

Web shell, logs and metrics
Every MicroVM’s show page has Logs and Metrics tabs, and a Shell tab when shell ingress is enabled.
Before you begin
Section titled “Before you begin”- A running MicroVM. See Create a MicroVM.
- For the Shell tab, the MicroVM must have Shell (envd) enabled, which needs an image built from, or based on,
sandbox-base. See Create an image.
Web shell
Section titled “Web shell”Open the MicroVM and go to the Shell tab. A terminal connects over the platform’s own relay, so no inbound port or public IP is required; a Connected badge confirms the session, and Paste, Ctrl-C, Clear and Download session sit above the terminal.
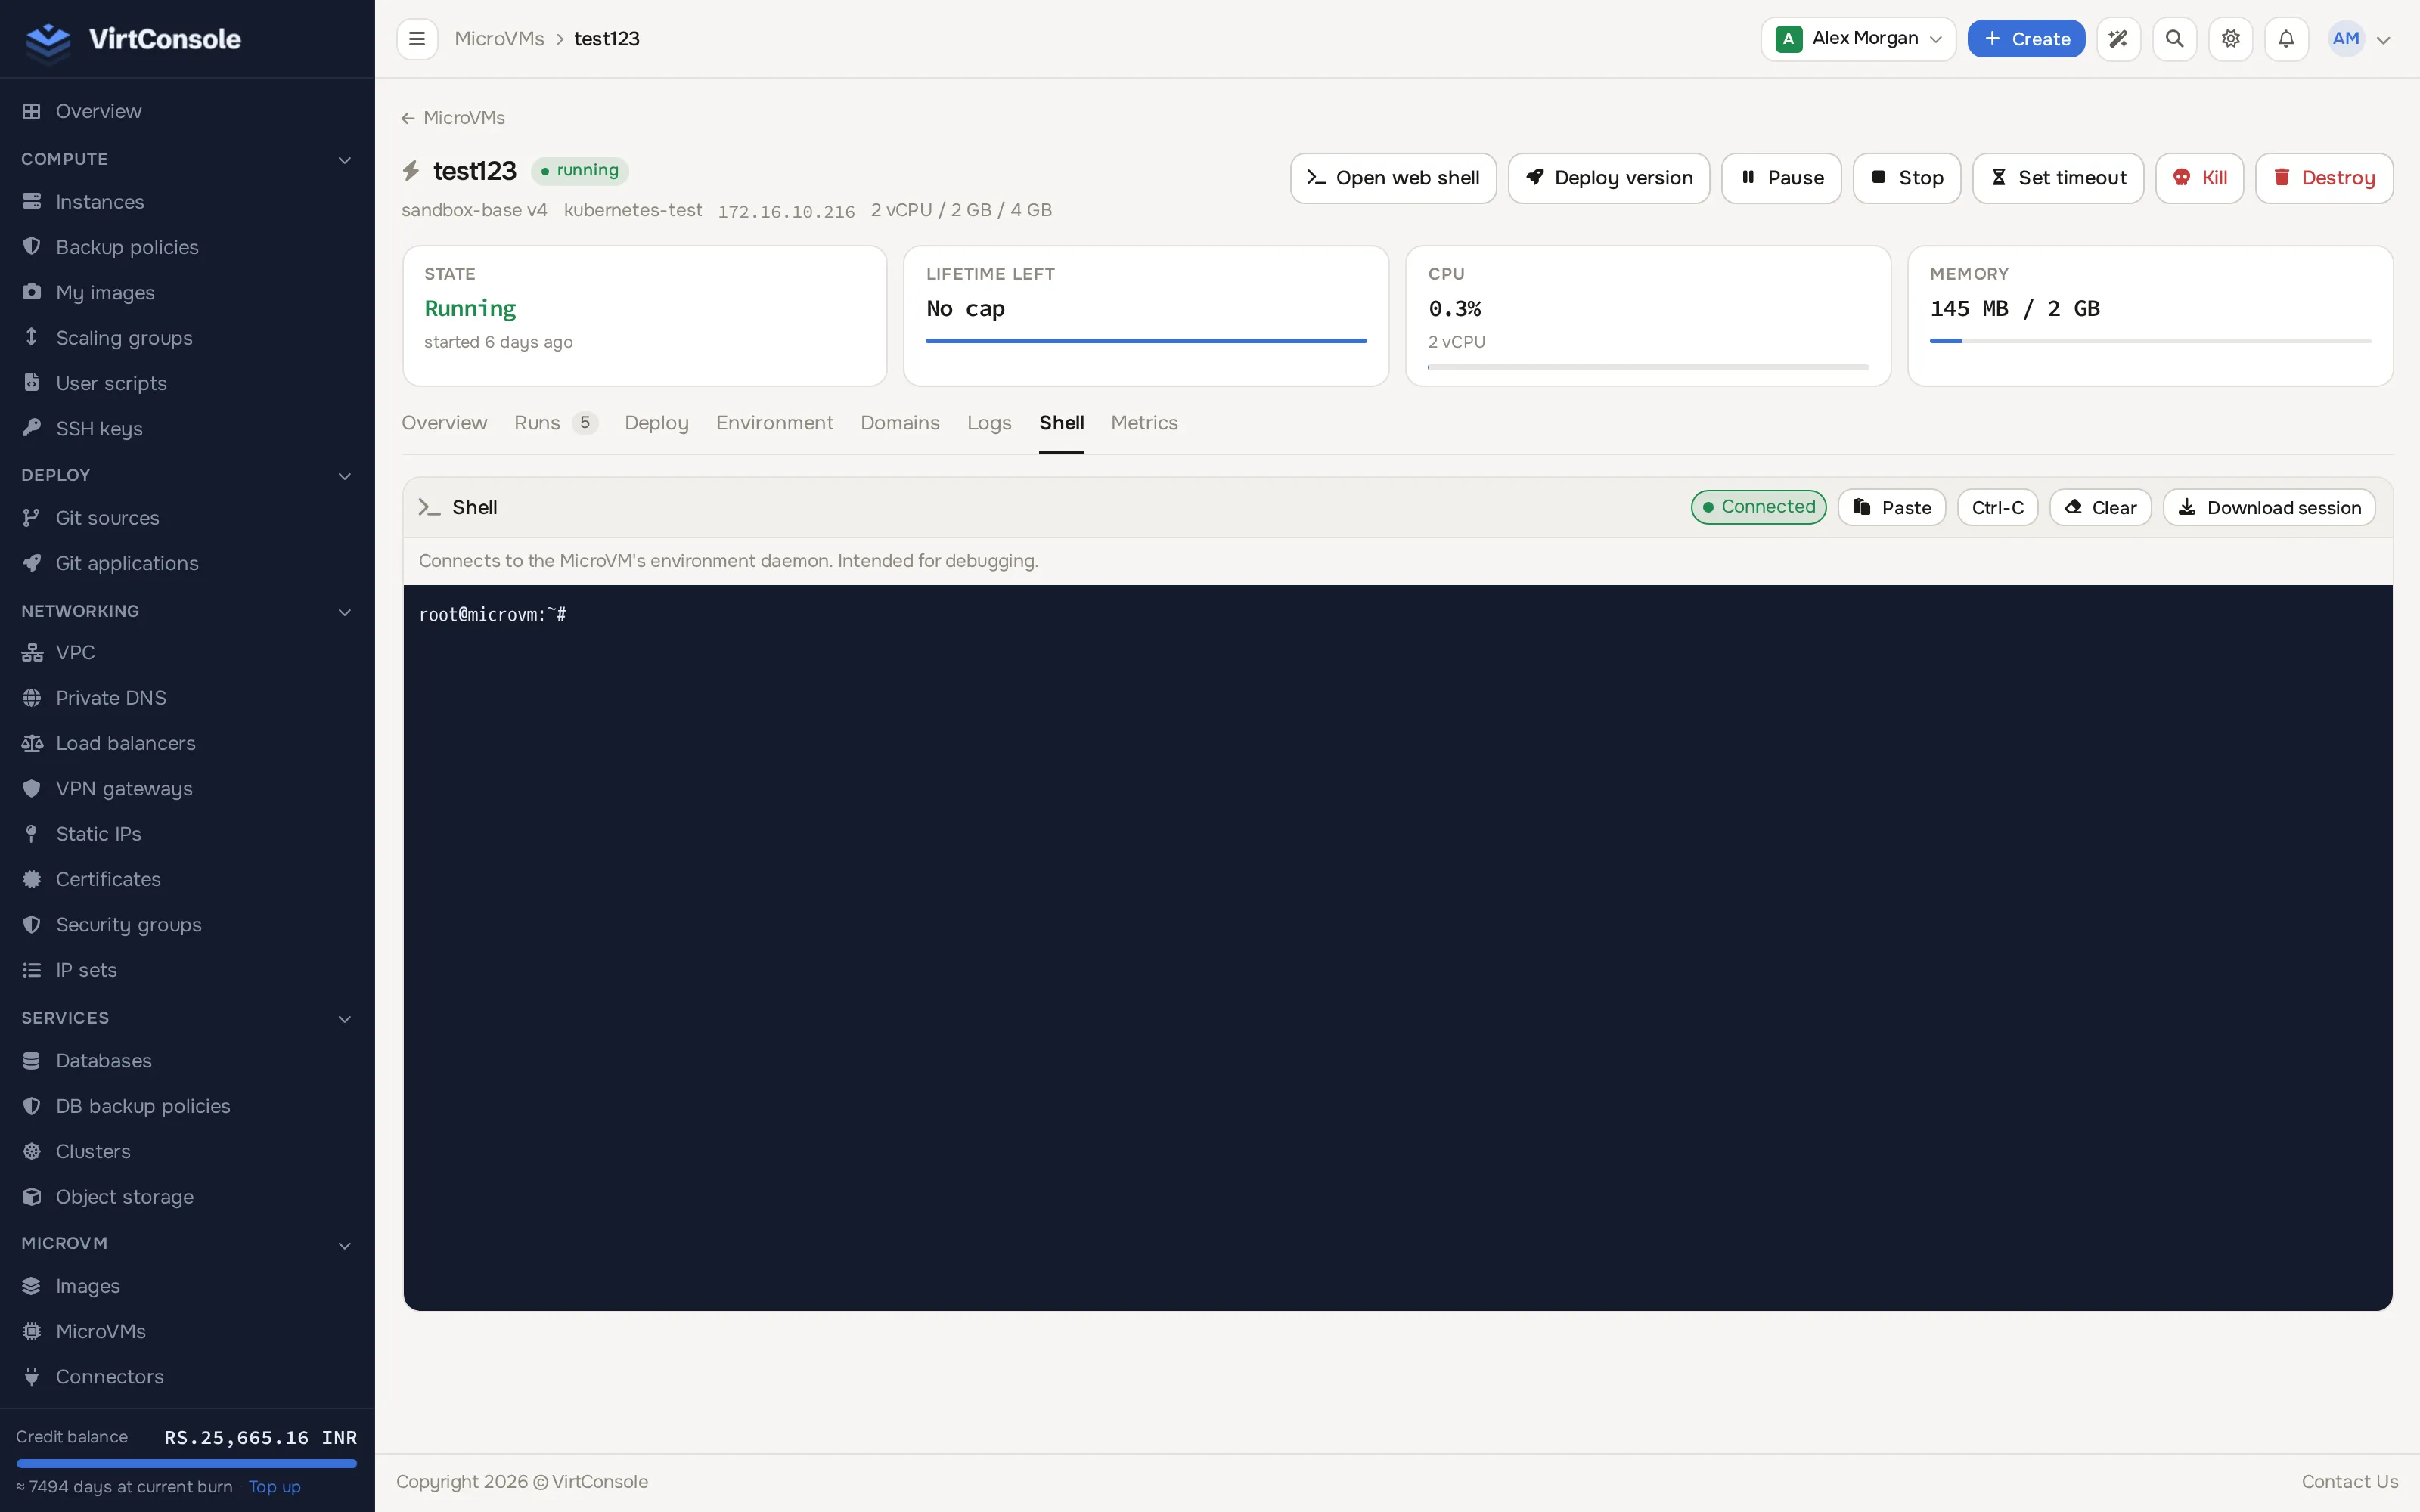
If shell ingress is off, or the image does not include envd, the tab shows a warning instead of a terminal and explains which of the two is missing.
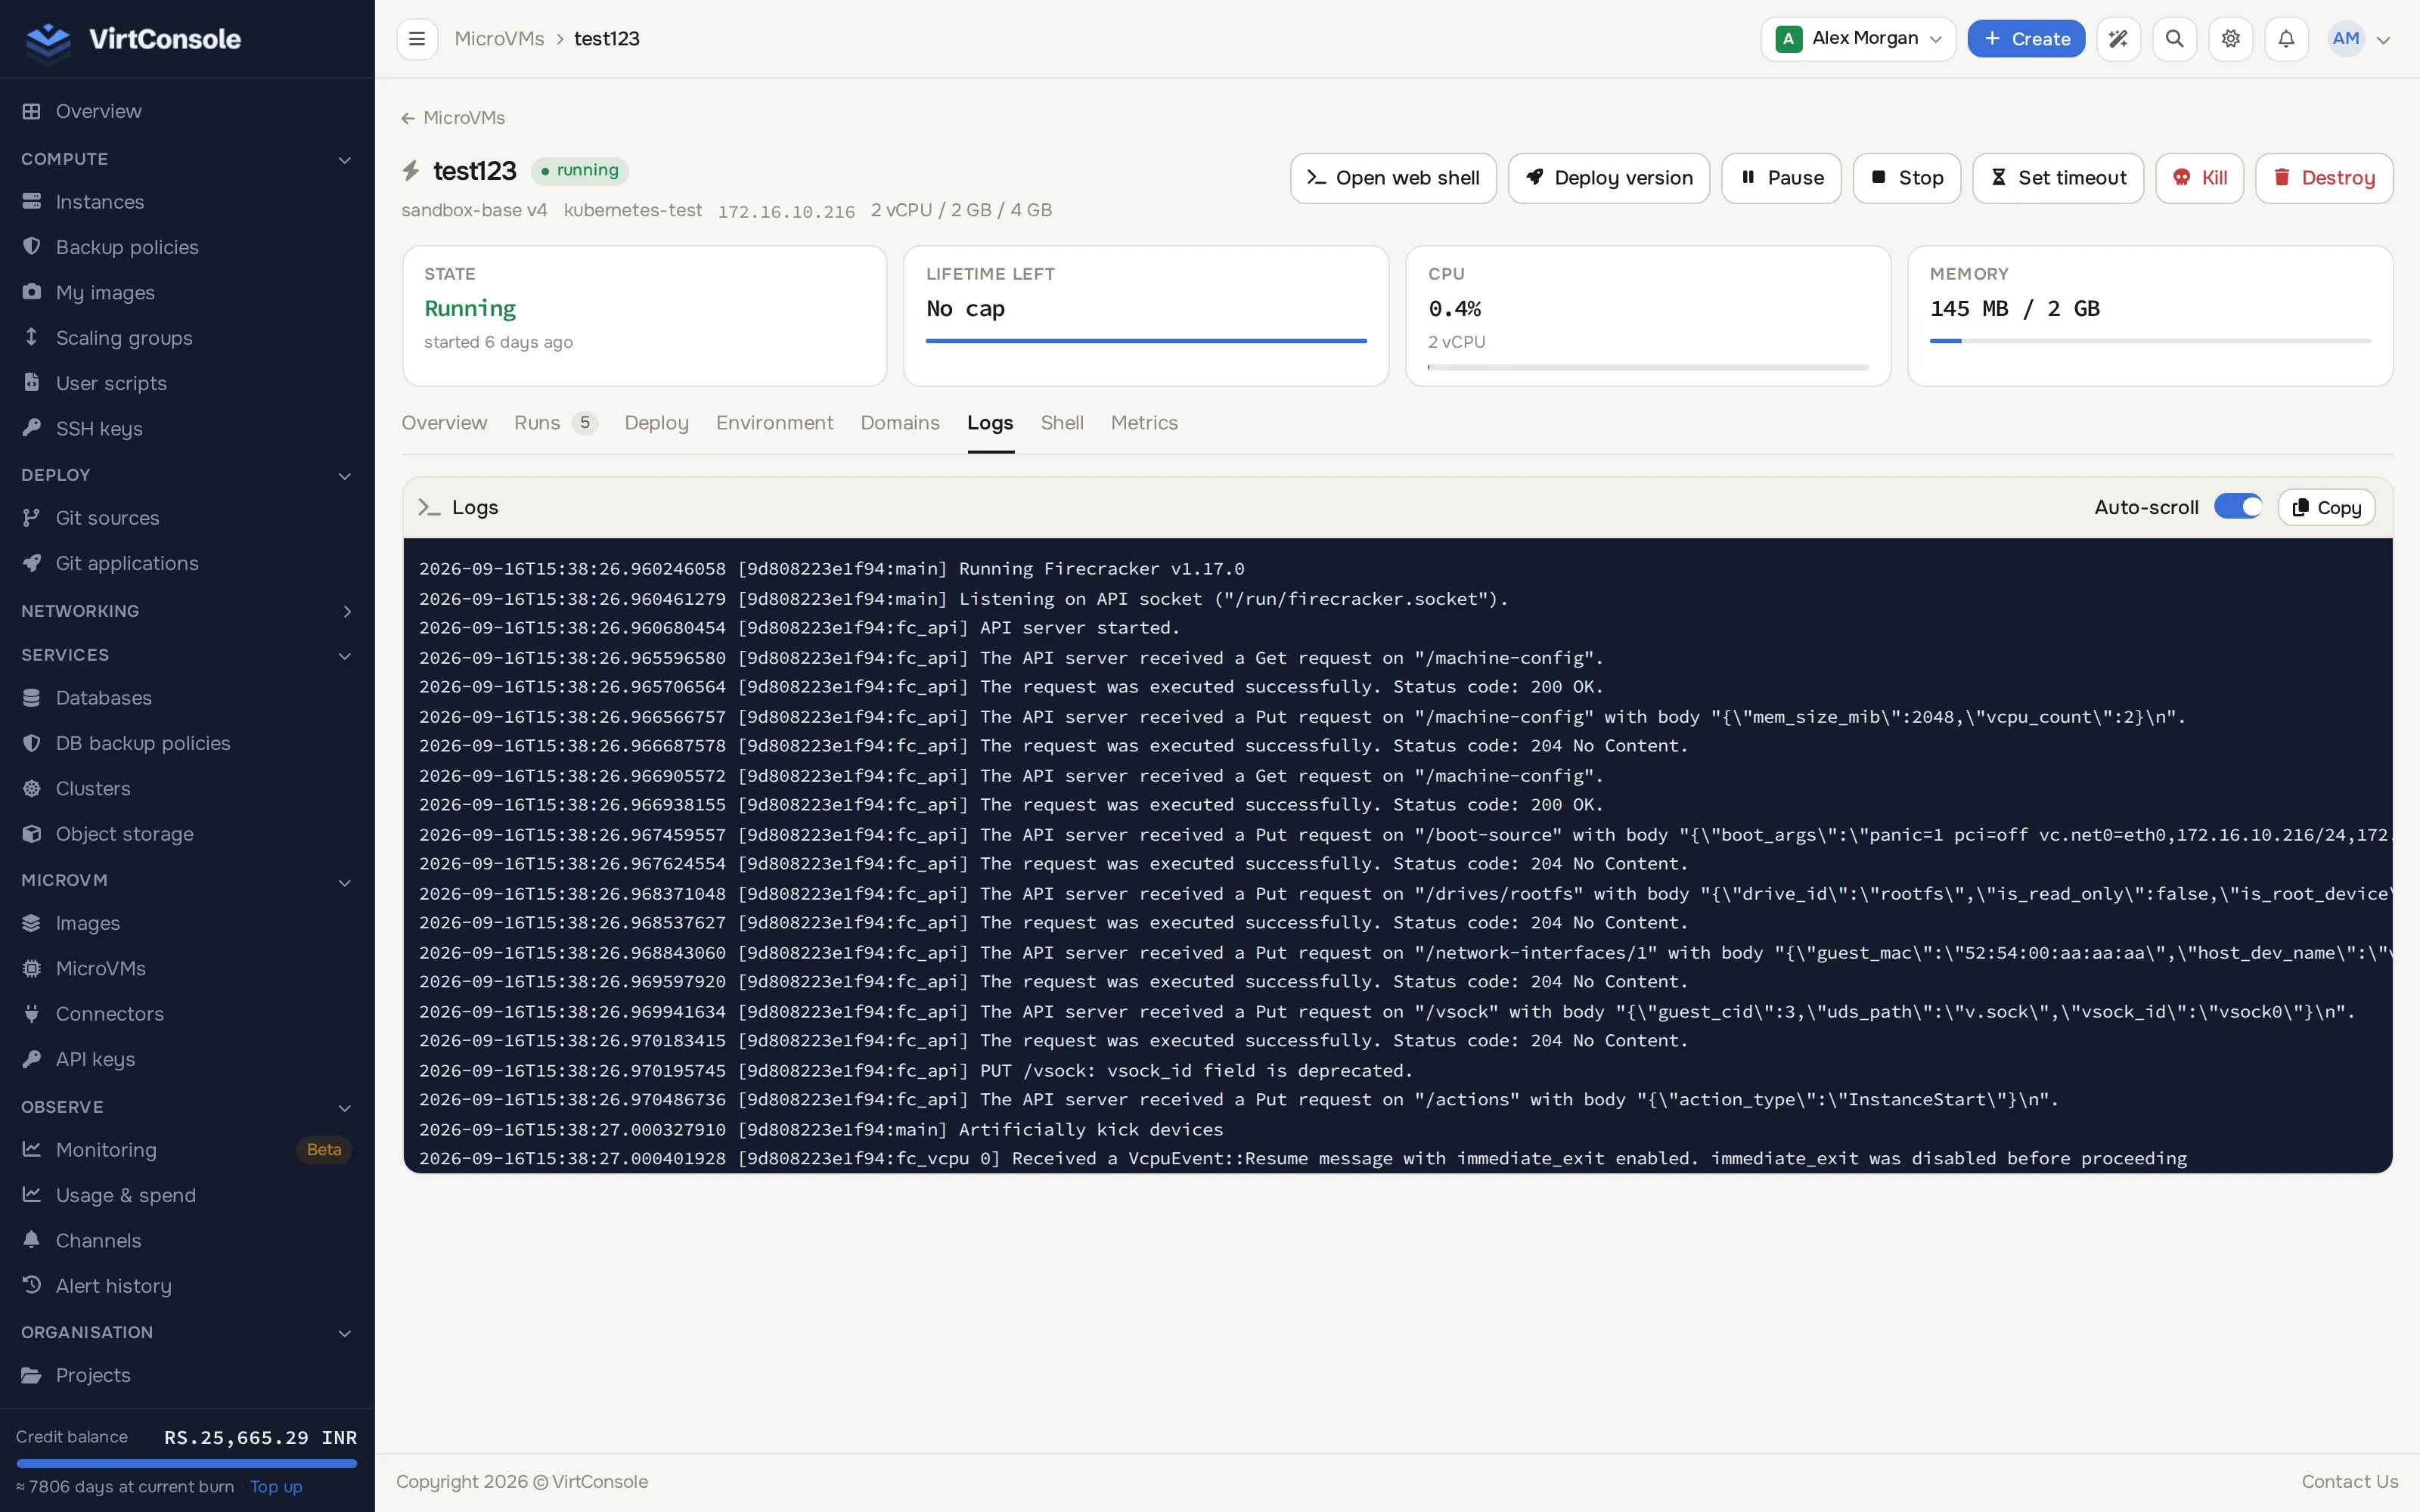
The Logs tab shows a live tail of the MicroVM’s guest console output, the same output the kernel and your init process print during boot and while running. It polls for new output every few seconds and keeps appending; toggle Auto-scroll off to read a scrollback without it jumping, and use Copy to copy everything shown so far.
Metrics
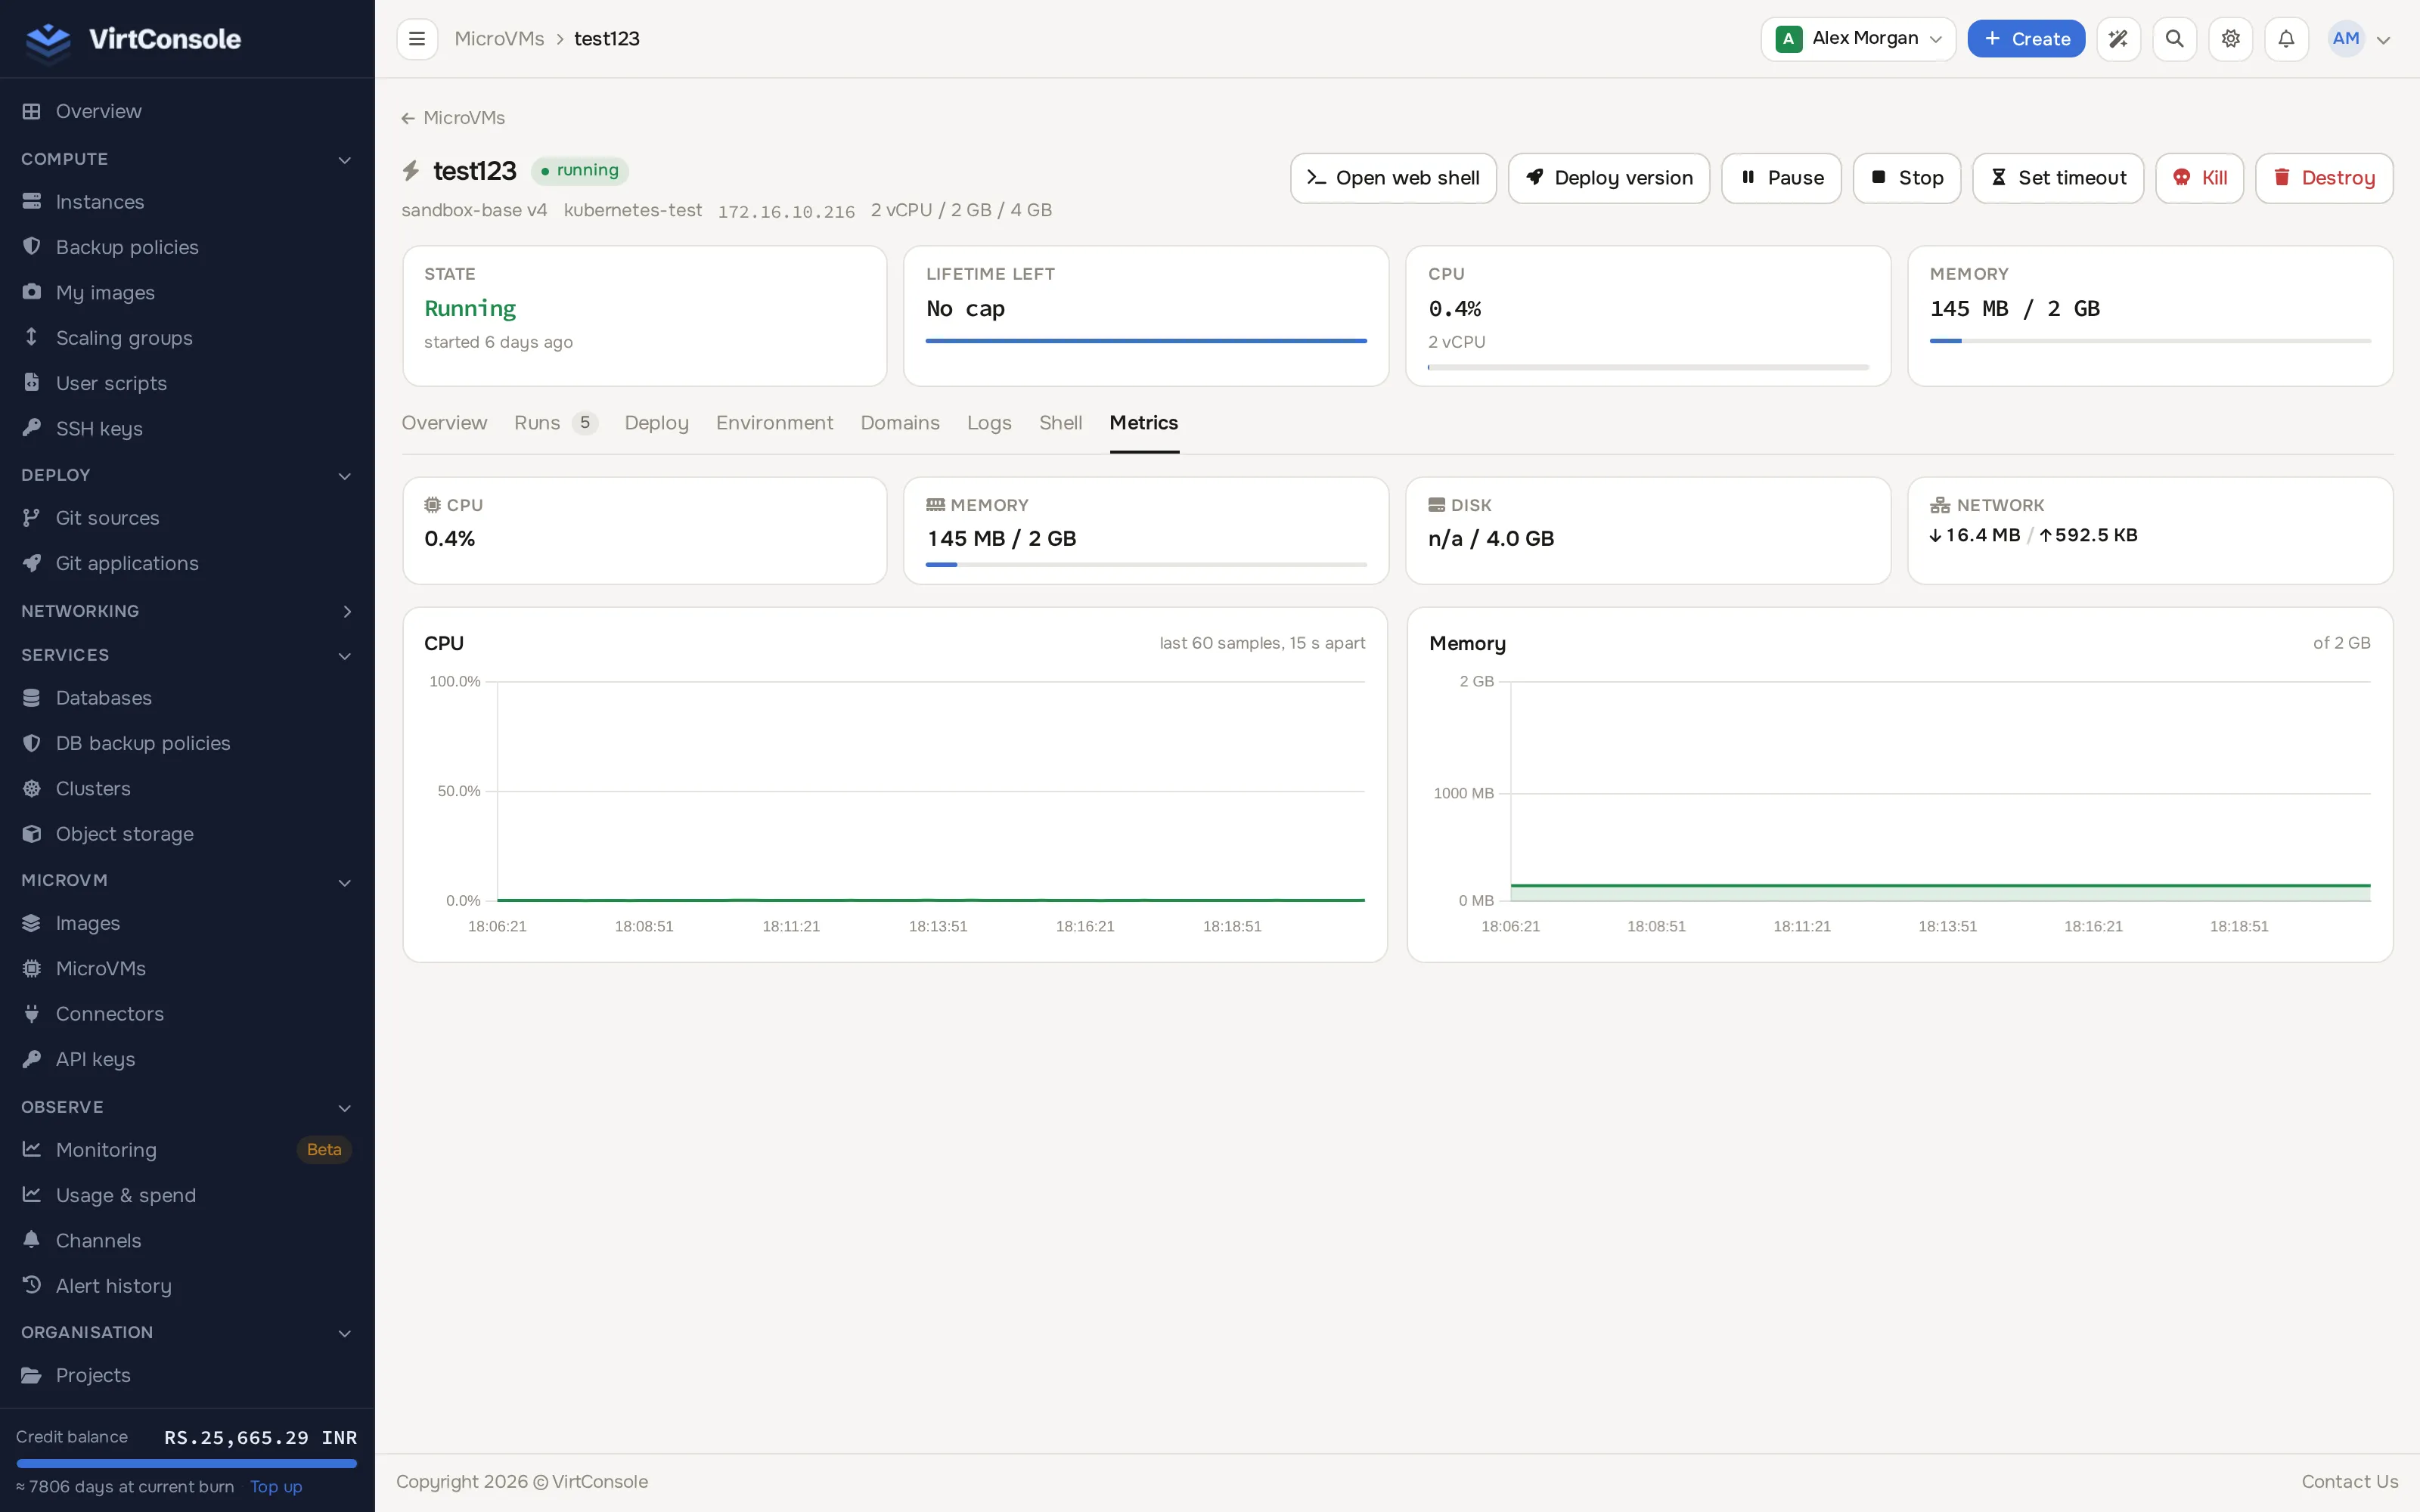
Section titled “Metrics”The Metrics tab shows live figures and short history charts:
| Metric | What it shows |
|---|---|
| CPU | Percentage of the plan’s allotted vCPU currently in use, with a short history chart. |
| Memory | Used and total memory in MiB, with a short history chart. |
| Disk | Used and total disk in GiB, when the node can report actual usage. |
| Network | Bytes received and sent since the MicroVM started. |
Common problems
Section titled “Common problems”- The Shell tab never connects. The MicroVM must be running, not paused or stopped.
- Logs stop updating. The MicroVM has been paused or stopped; console output only accumulates while it runs.
- Metrics show all zeroes. The MicroVM is paused or stopped; live metrics are only available while running (or paused, for a brief snapshot).