

The admin dashboard
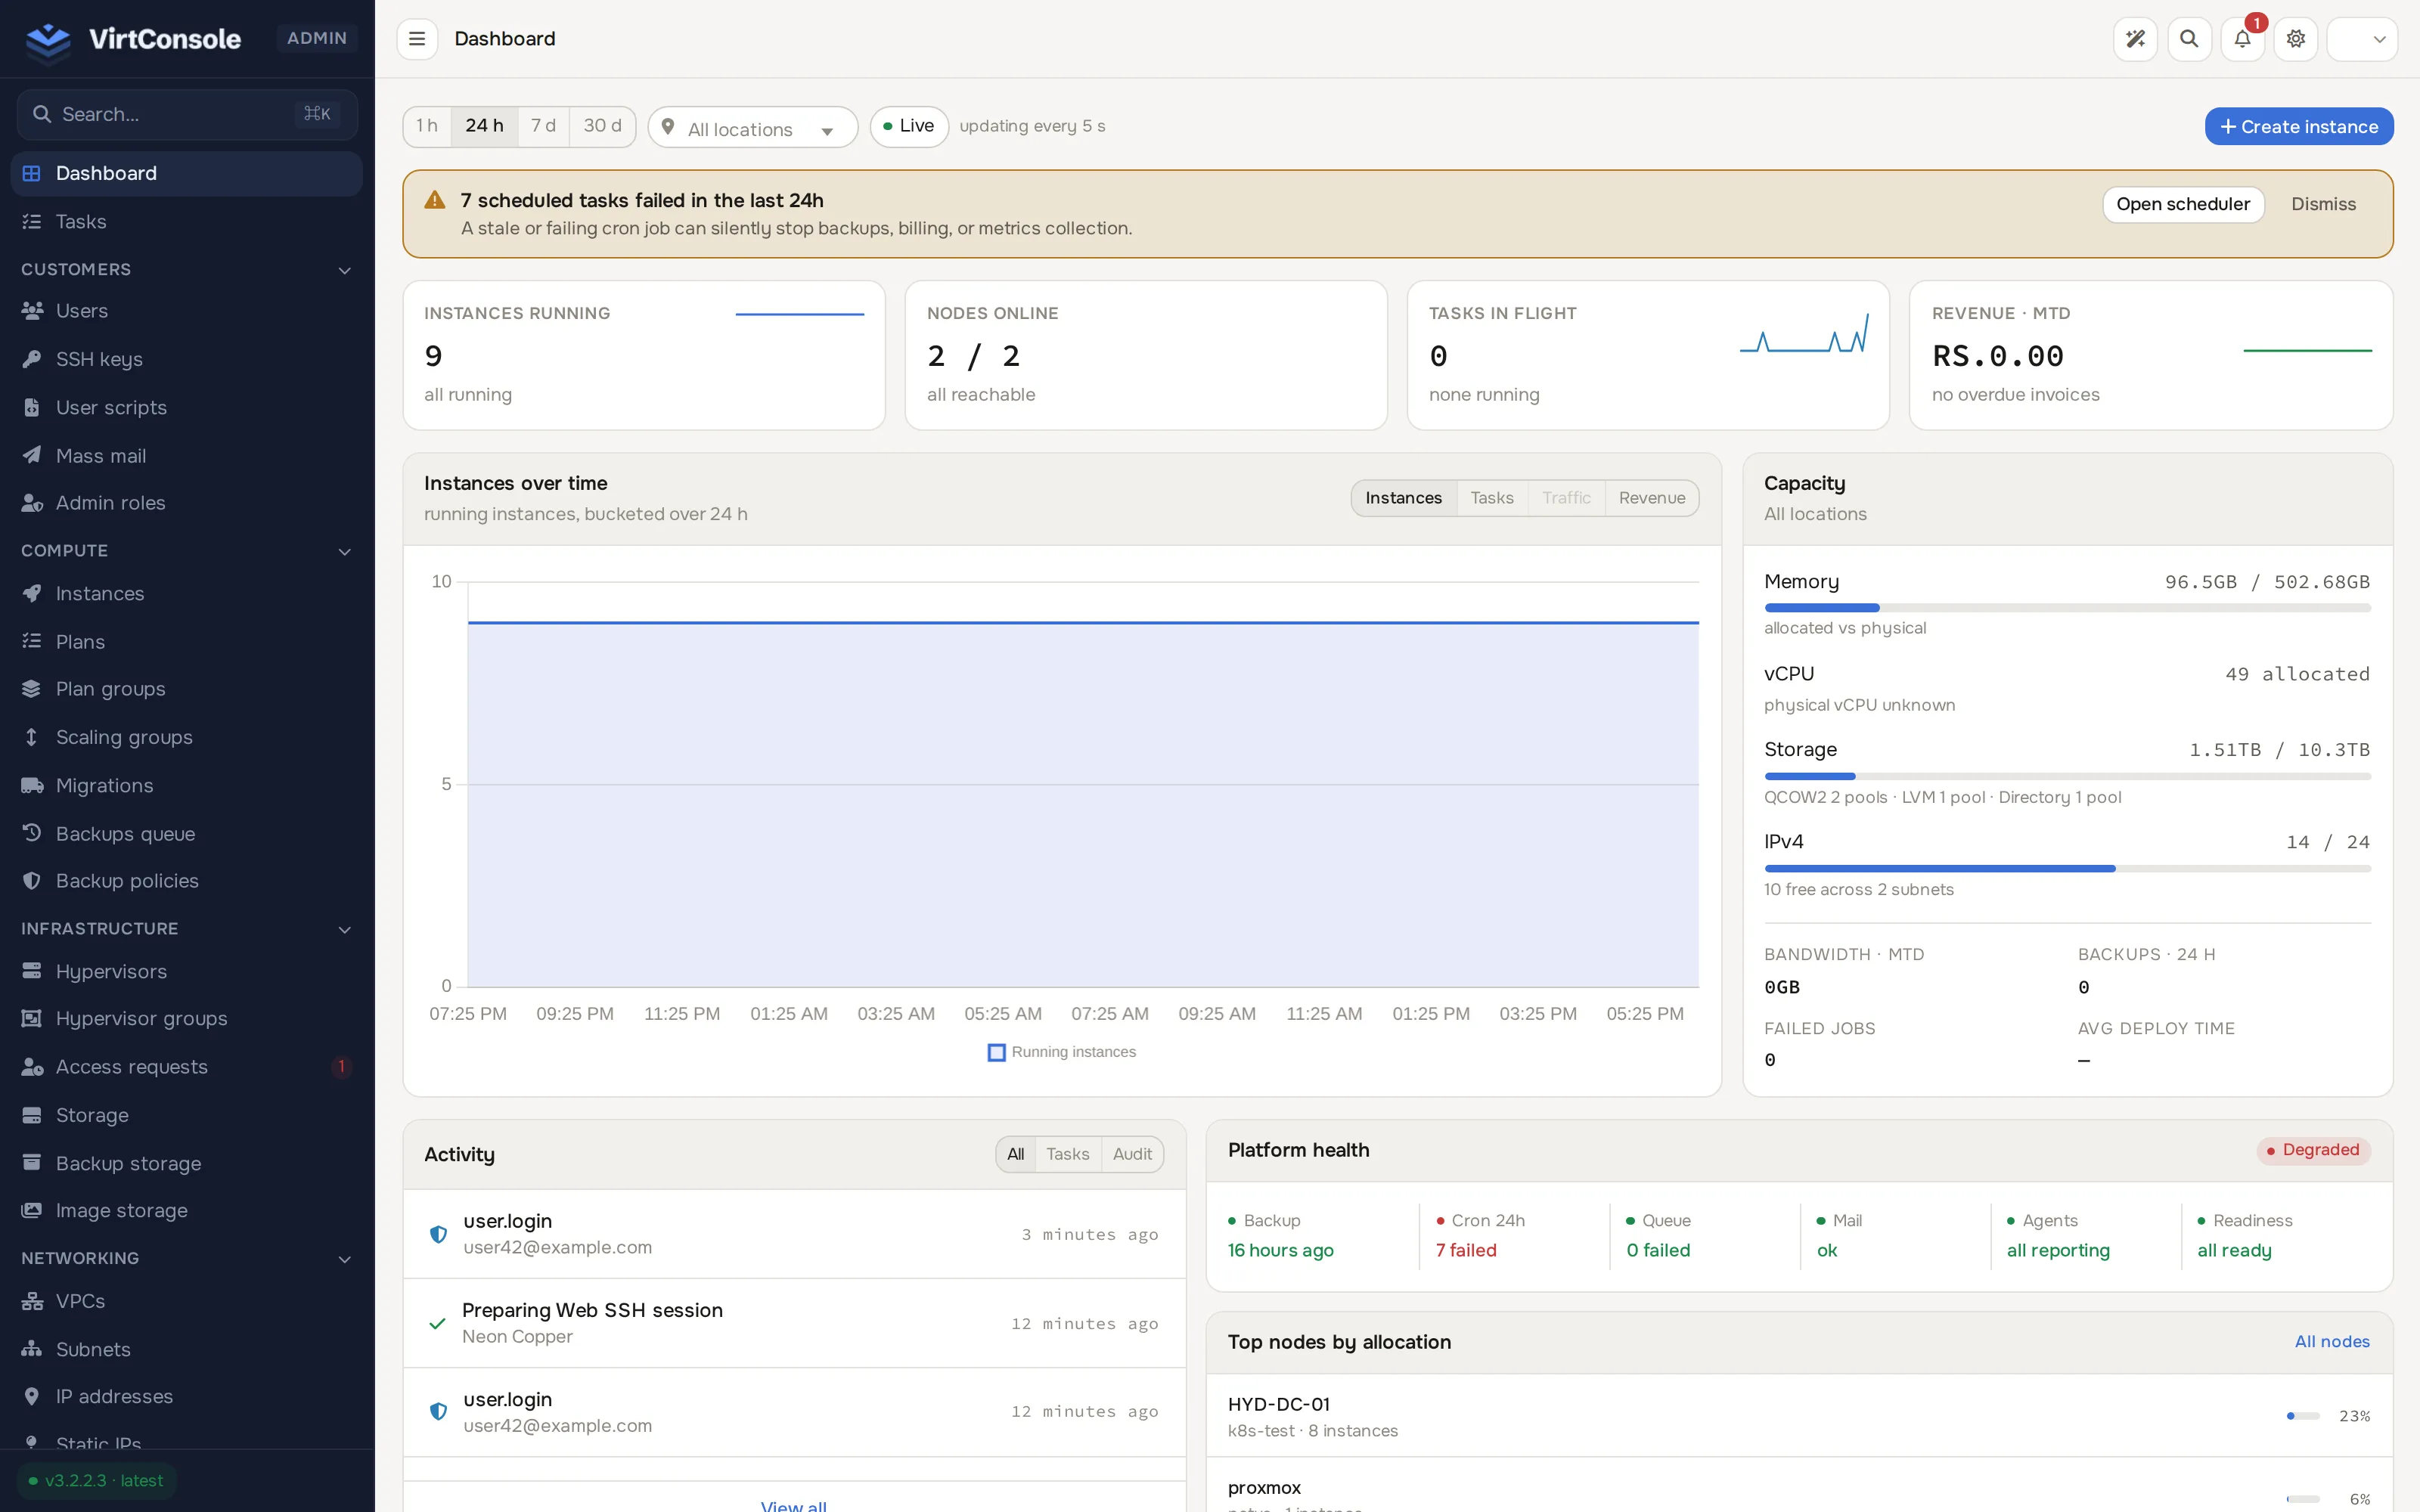
The dashboard is the first screen after you log in to the admin panel. It answers two questions at a glance: is the platform healthy, and is anything running that needs your attention. It refreshes on its own every 5 seconds while you have it open.
What it shows
Section titled “What it shows”Toolbar. A time-range switcher (1 h, 24 h, 7 d, 30 d) that drives the chart below, a location dropdown to scope everything on the page to one region, a Live indicator, and a Create instance button.
Alert banners. One banner per real problem, each with its own Dismiss button and, where useful, a button that jumps straight to the page that fixes it (for example Open scheduler when scheduled tasks have been failing). A dismissed banner stays dismissed until the condition changes. There is also a separate banner, shown only to admins, when a newer platform version is available.
Stat cards. A row of live KPI tiles, each with a small trend sparkline:
- Instances running: the current count, with how many are migrating shown as a delta when relevant.
- Nodes online: online vs total hypervisors, with an unreachable count when any are down.
- Tasks in flight: tasks currently active, with a migrating count when relevant.
- Revenue · MTD: month-to-date revenue against the same period last month. Shown only when the built-in billing is enabled.
Instances over time. A chart of the selected time range with tabs to switch its series between Instances, Tasks, Traffic and Revenue.
Capacity. Scoped to the location picked in the toolbar (or All locations):
- Memory: allocated vs physical RAM across the scope.
- vCPU: vCPU allocated (shows a plain count instead of a bar when the physical vCPU total is not known).
- Storage: used vs total across all storage pools, broken down by backend (QCOW2, LVM, Ceph, and so on).
- IPv4: used vs total addresses, with how many are free and across how many subnets.
Below the meters, four figures: Bandwidth · MTD, Backups · 24 h, Failed jobs, and Avg deploy time.
Activity. A live feed with All, Tasks and Audit tabs, each row showing what happened, who did it and when, with a progress bar on rows that are still running. View all goes to the full list for the selected tab.
Platform health. Six columns, each a status dot and a value, that link to the page where you would fix a problem: Backup (age of the last system backup), Cron 24h (failed scheduled jobs in the last day), Queue (failed background jobs), Mail (recent delivery failures), Agents (hypervisors reporting on time), and Readiness (hypervisors with pending deployment-readiness checks). The card header shows an overall Healthy or Degraded badge; degraded also names how many nodes are down when that is the cause.
Top nodes by allocation. The busiest hypervisors by resource allocation, each with its location, instance count and an allocation bar. Shows at most 3 rows with the rest reachable via All nodes.
Revenue mix · 30 d. A breakdown of the last 30 days of revenue by source, with a Billing shortcut. Shown only when billing is enabled.
Node spotlight. Pick any hypervisor from the dropdown to see its online state, uptime, IP, Memory and Storage usage, and its instance counts split into Instances, Active and Suspended, with an Open hypervisor link.
Support & queue. Counts that need a look, each linking straight to the matching queue: unassigned tickets, tickets at risk of an SLA breach, open tickets, pending reverse DNS requests, pending KYC reviews, and pending access requests.
News & updates. Product announcements as a row of cards along the bottom of the page, with an All updates link.
Tips for daily use
Section titled “Tips for daily use”- After a fresh install every counter is zero. That is expected, not a fault.
- Use the search bar in the top bar to jump straight to a user, instance, hypervisor, subnet, IP address or storage pool by name or address.
- A red or amber dot in Platform health is always worth clicking. It links to the page where you can fix the cause.
- The location dropdown and time-range switcher affect the whole page except Activity, Support & queue and News & updates, which are always account-wide.