

Monitoring and alerts
The Monitoring section shows live graphs for your resources and lets you set alert rules, so you hear about problems before your users do. Your provider may mark this feature as Beta.
Where to find it
Section titled “Where to find it”In the user panel click Monitoring in the sidebar’s Observe group. Four tabs sit at the top: Resources, Alert rules, Channels and History.
Resources
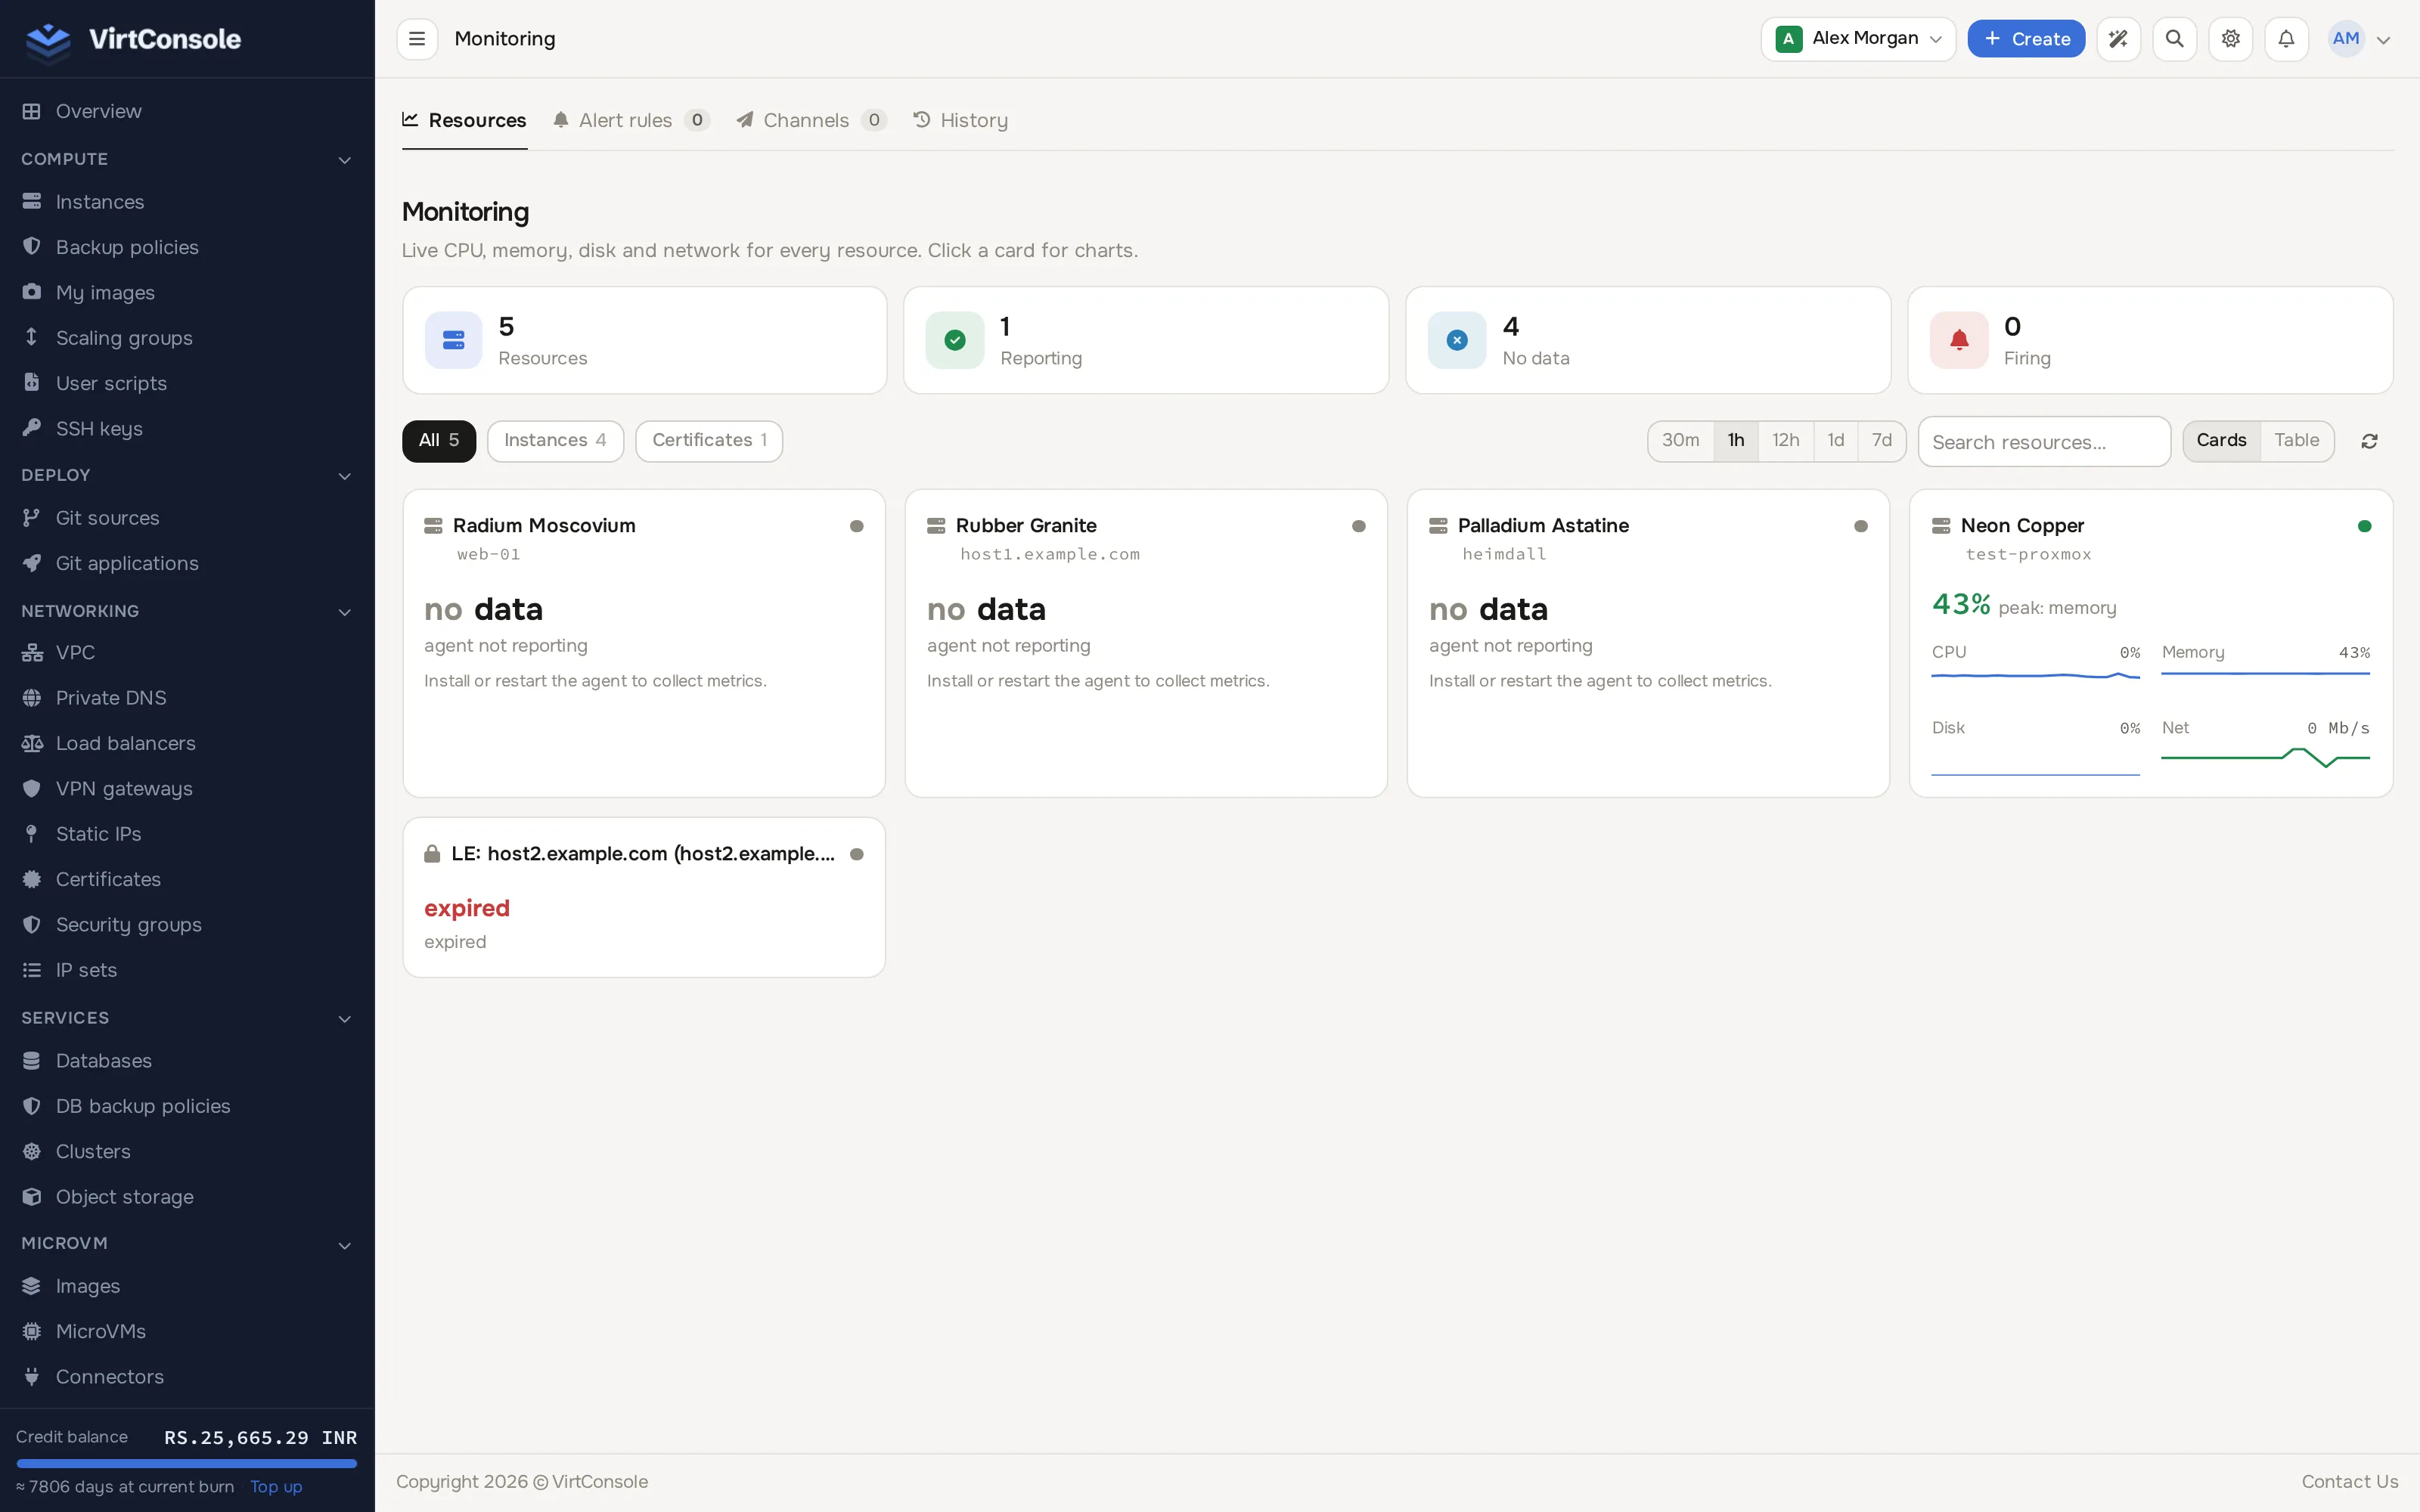
Section titled “Resources”The Resources tab opens on a summary strip (total resources, how many are reporting, how many have no data, how many alerts are firing), then filter pills per resource type (All, Instances, Certificates and so on), a time range picker (30m, 1h, 12h, 1d, 7d) and a Cards/Table view toggle. Each card shows the resource’s peak metric for the selected range; click a card to see its full graphs. What you get depends on the resource type:
- Instances: CPU usage, memory usage, network I/O, disk IOPS, disk throughput, disk usage.
- Managed databases: the same, plus engine metrics like connections, queries per second, slow queries, replication lag and cache hit ratio.
- Load balancers: frontend and backend sessions, request rate, connection rate, traffic, HTTP response codes, backend response time, queue and errors.
- Certificates: days until expiry and status.
The monitoring Resources tab.
Notification channels
Section titled “Notification channels”A channel is where alerts are delivered, for example a Slack or Discord webhook, Telegram, email or a generic webhook into your own system.
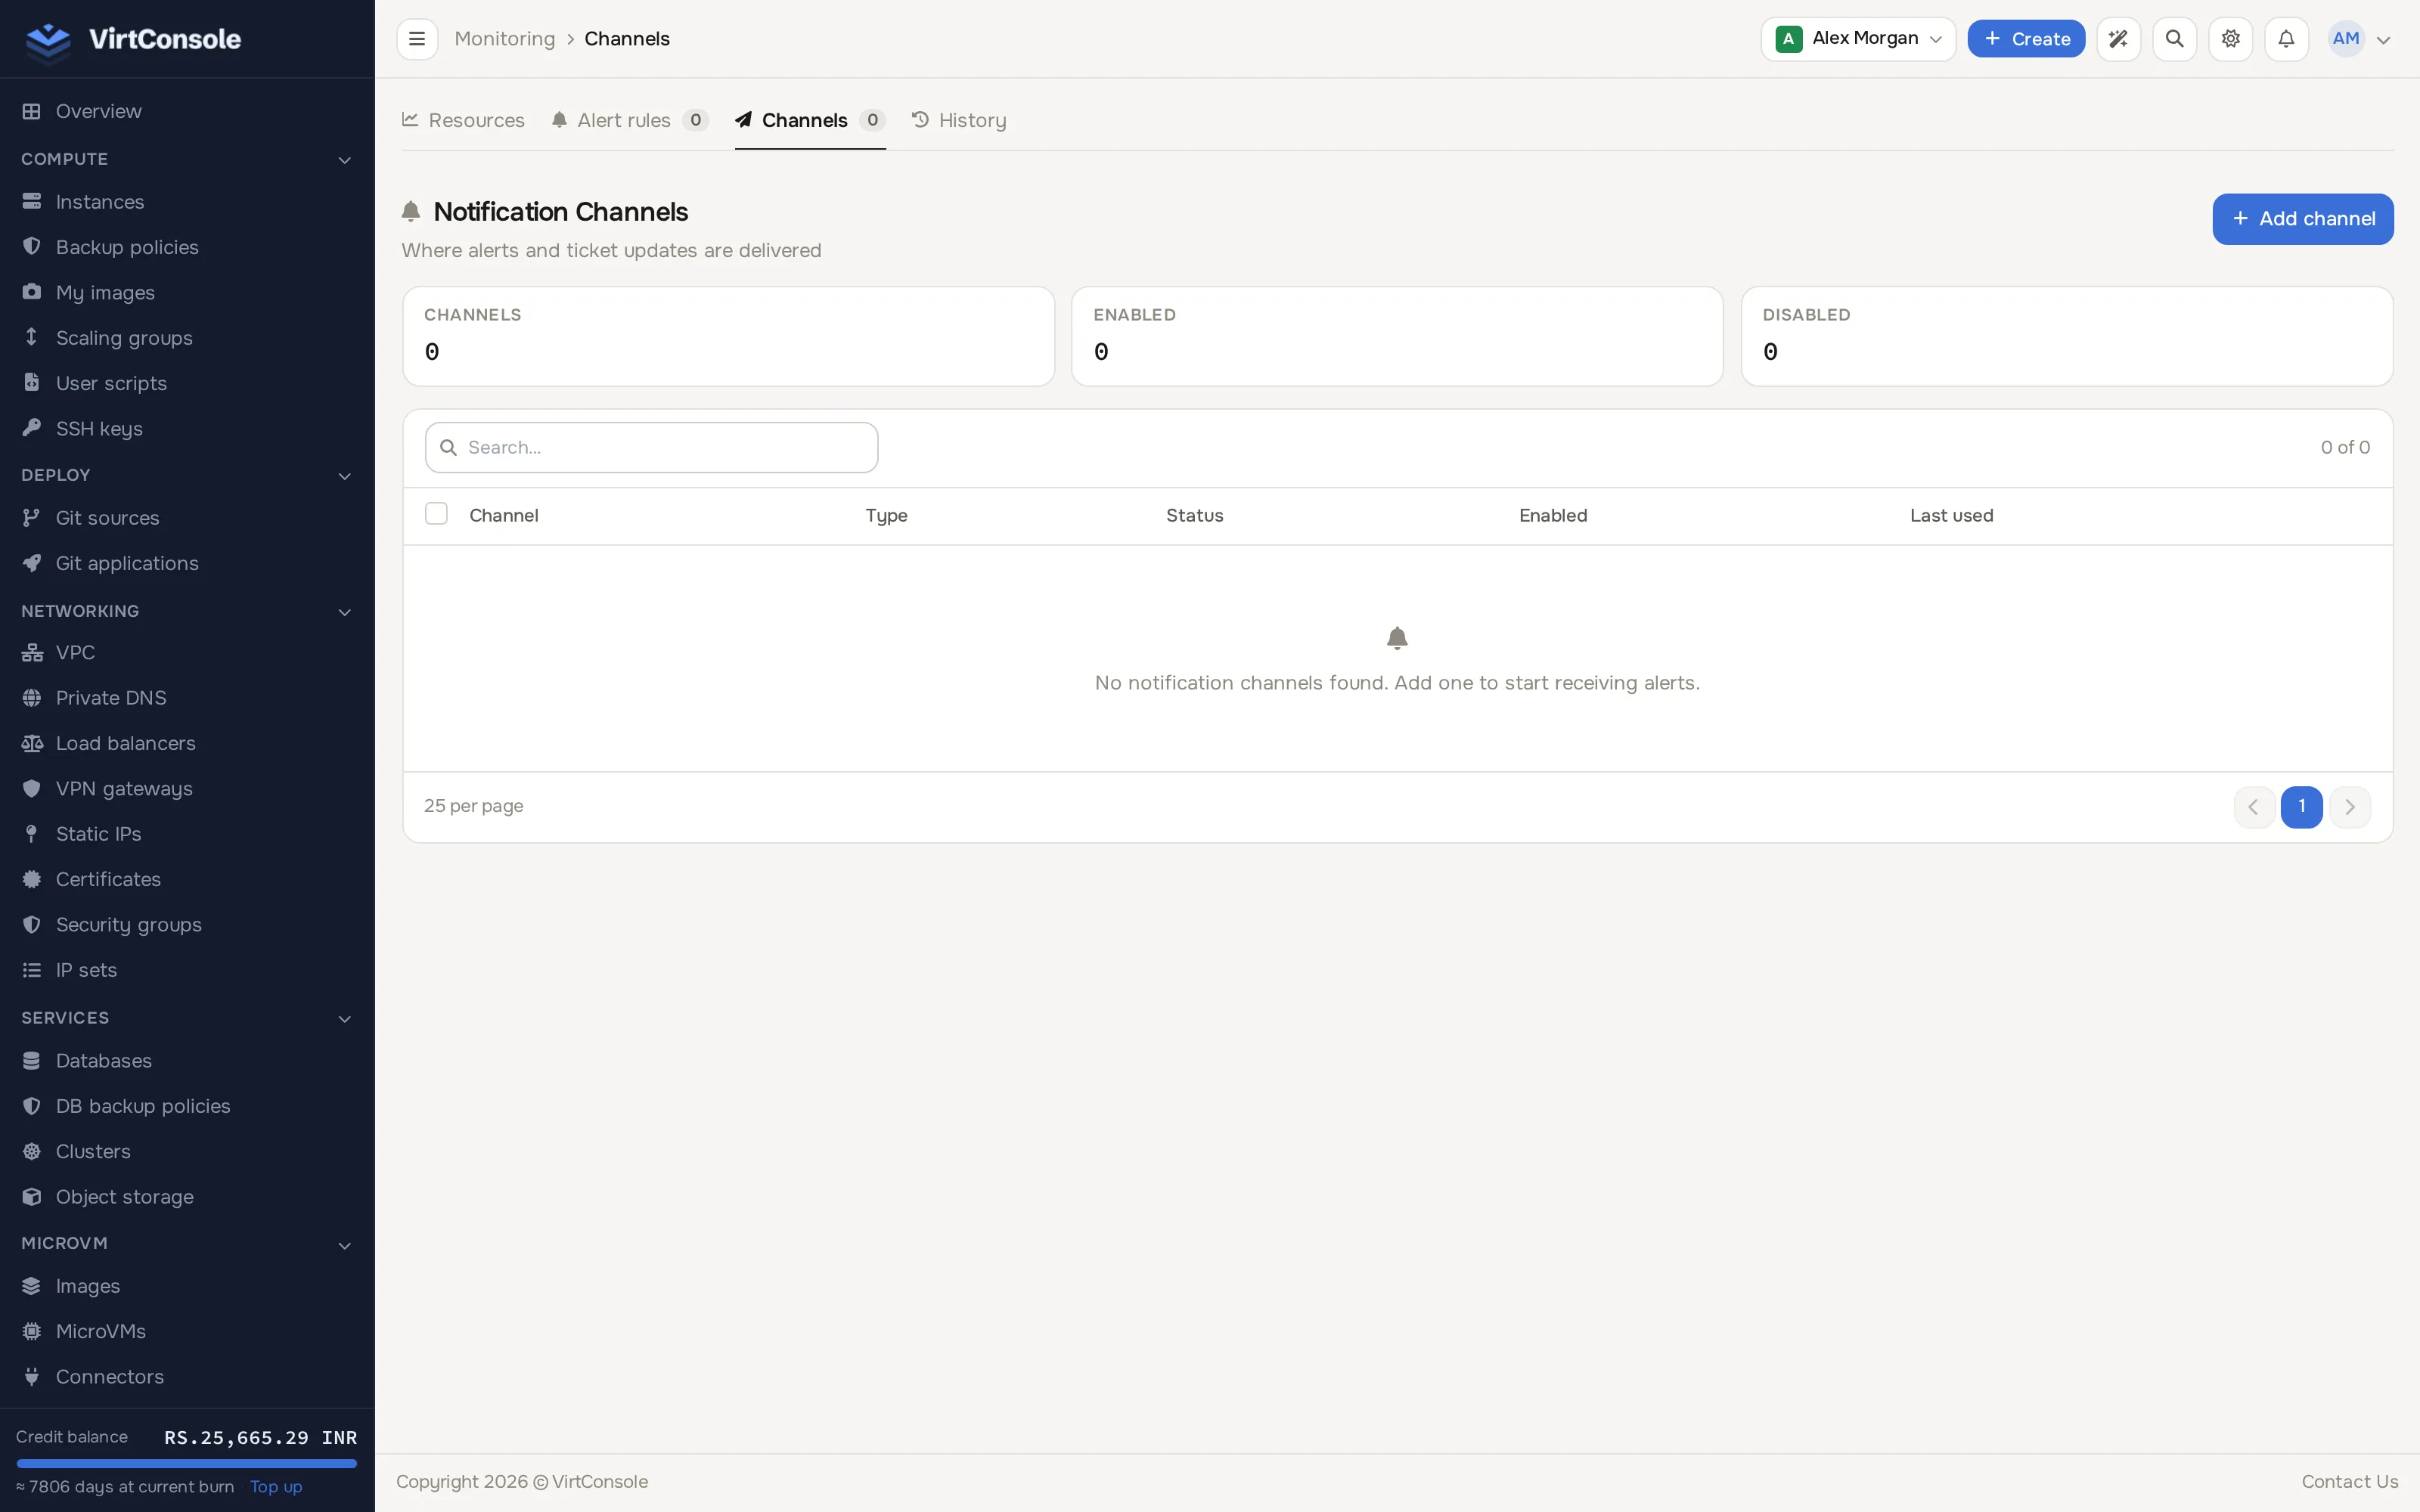
- Open the Channels tab and click Add channel.
- Name it, pick the type, and fill in its credential (webhook URL, bot token and so on).
- Use the test button on the channel to confirm delivery before relying on it.
Alert rules
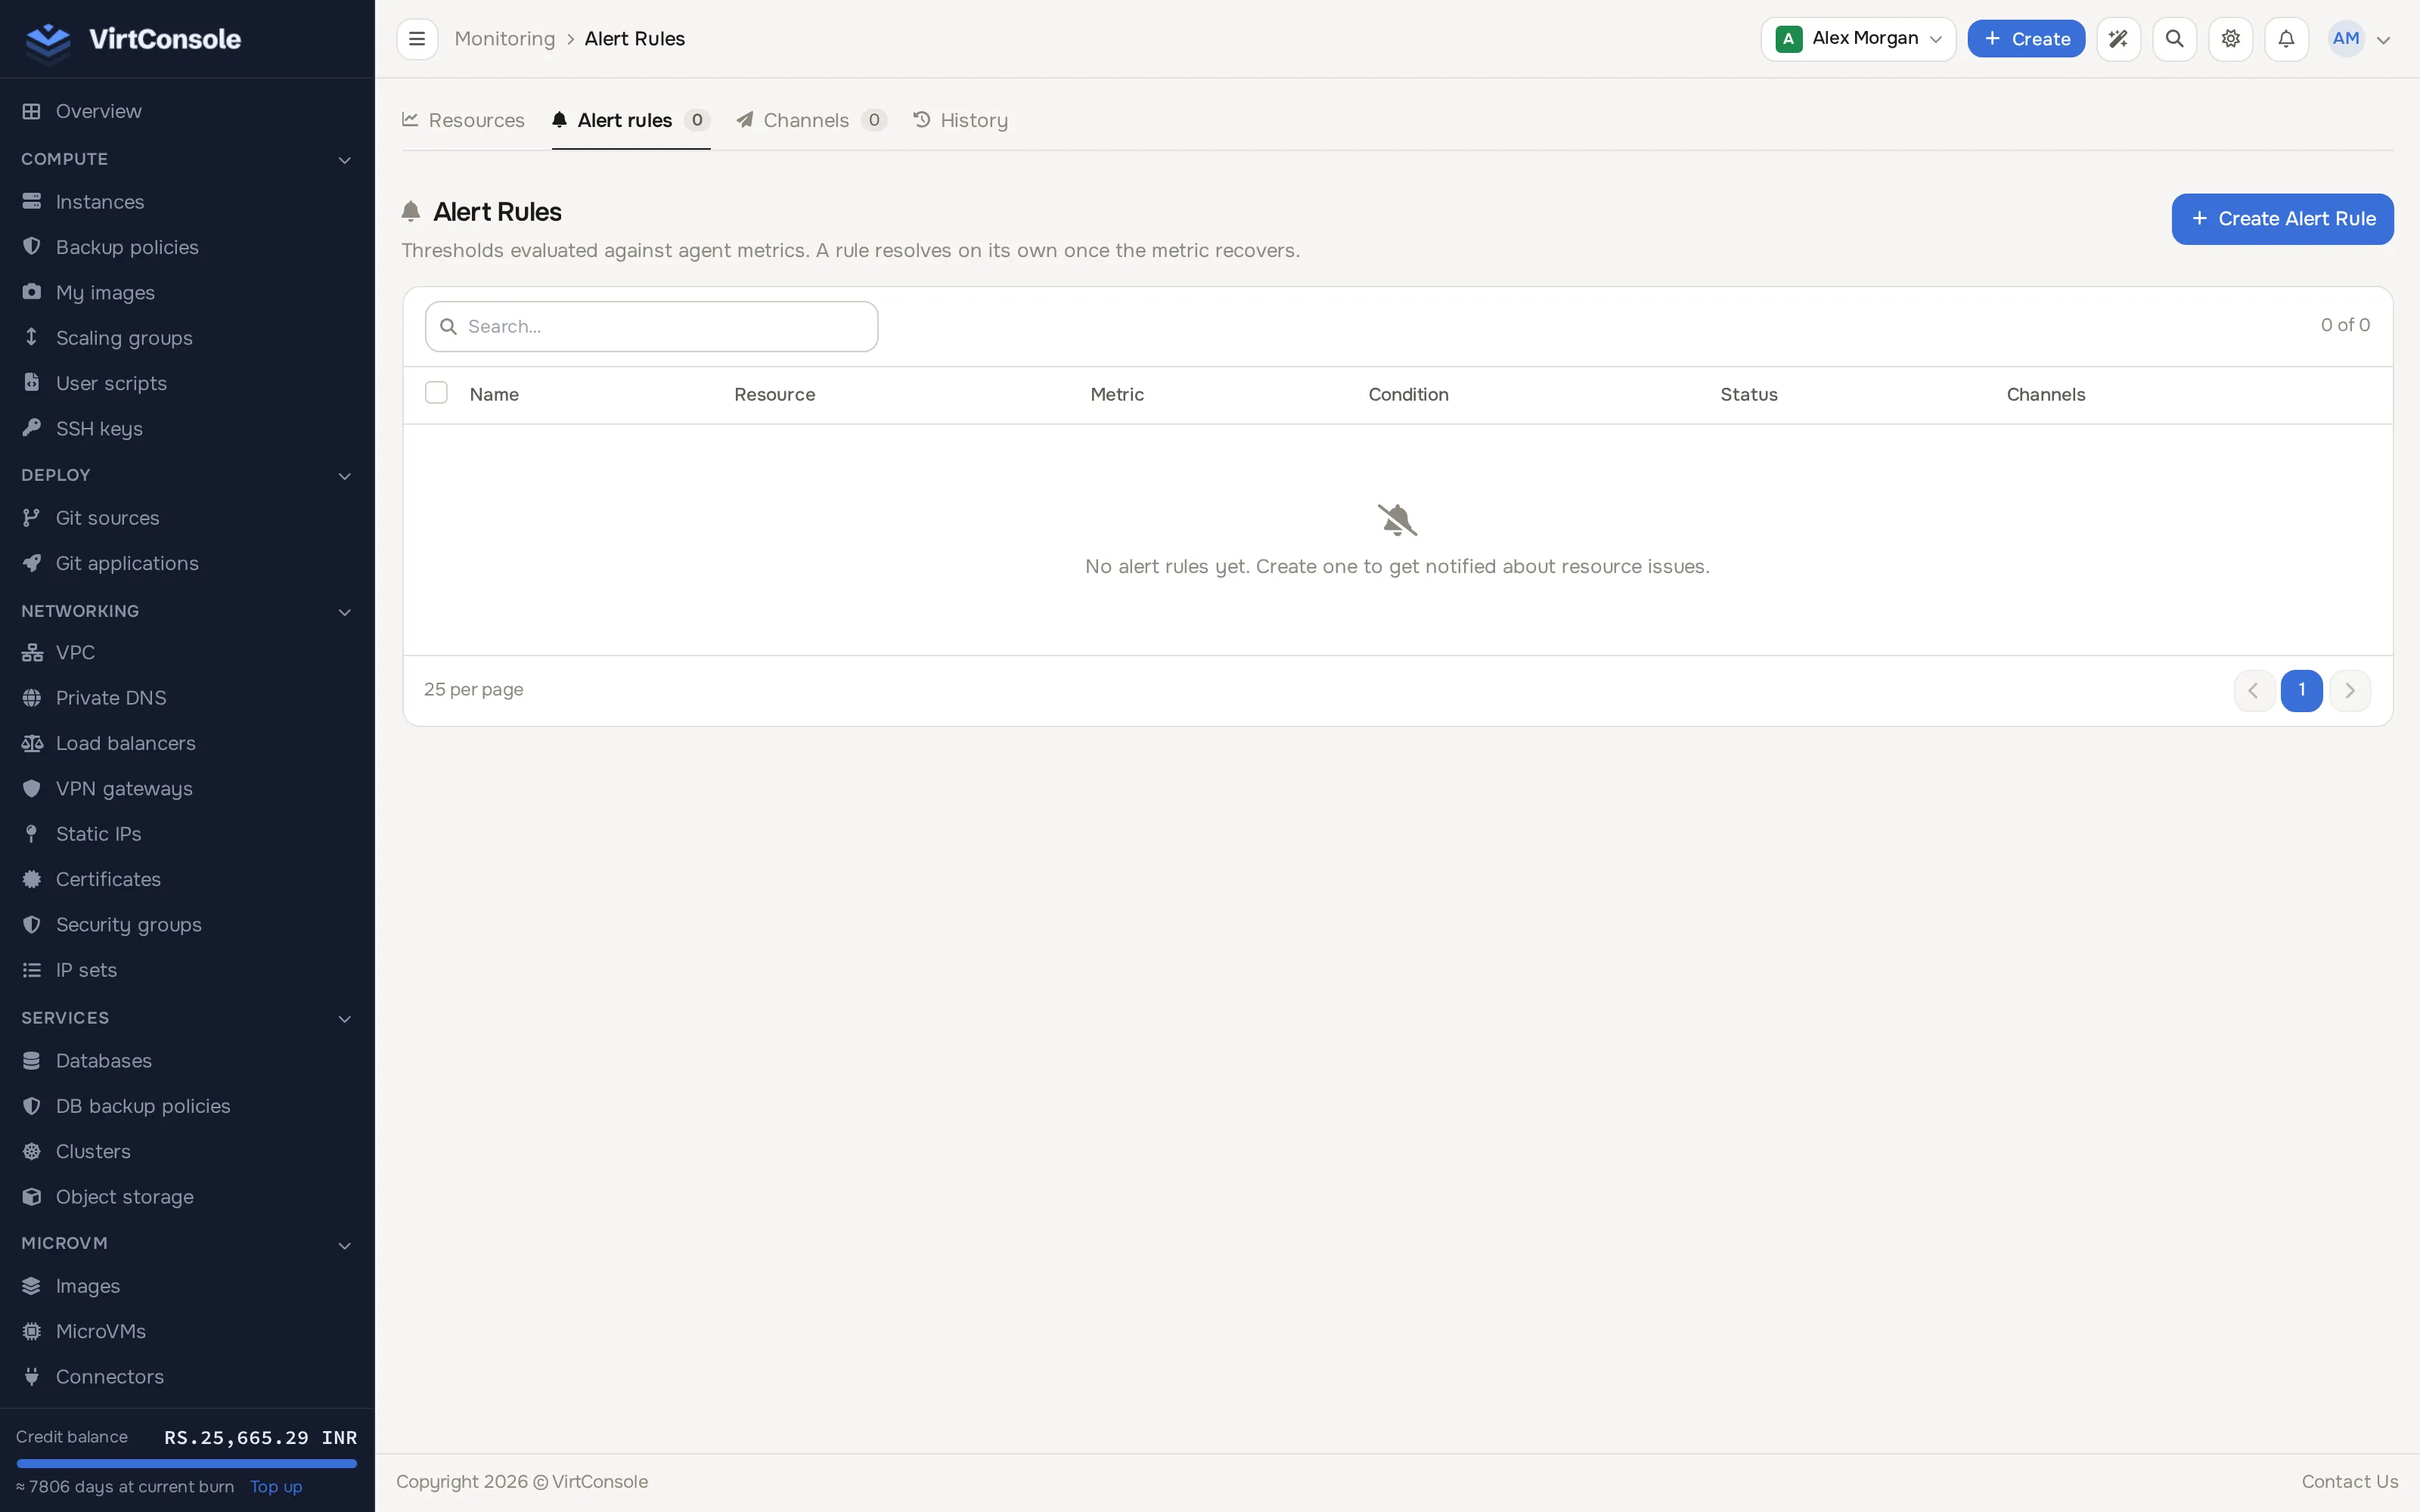
Section titled “Alert rules”An alert rule watches a metric on a resource and fires when it crosses your threshold: high CPU, low disk, a database falling behind on replication, a certificate nearing expiry, and so on.
-
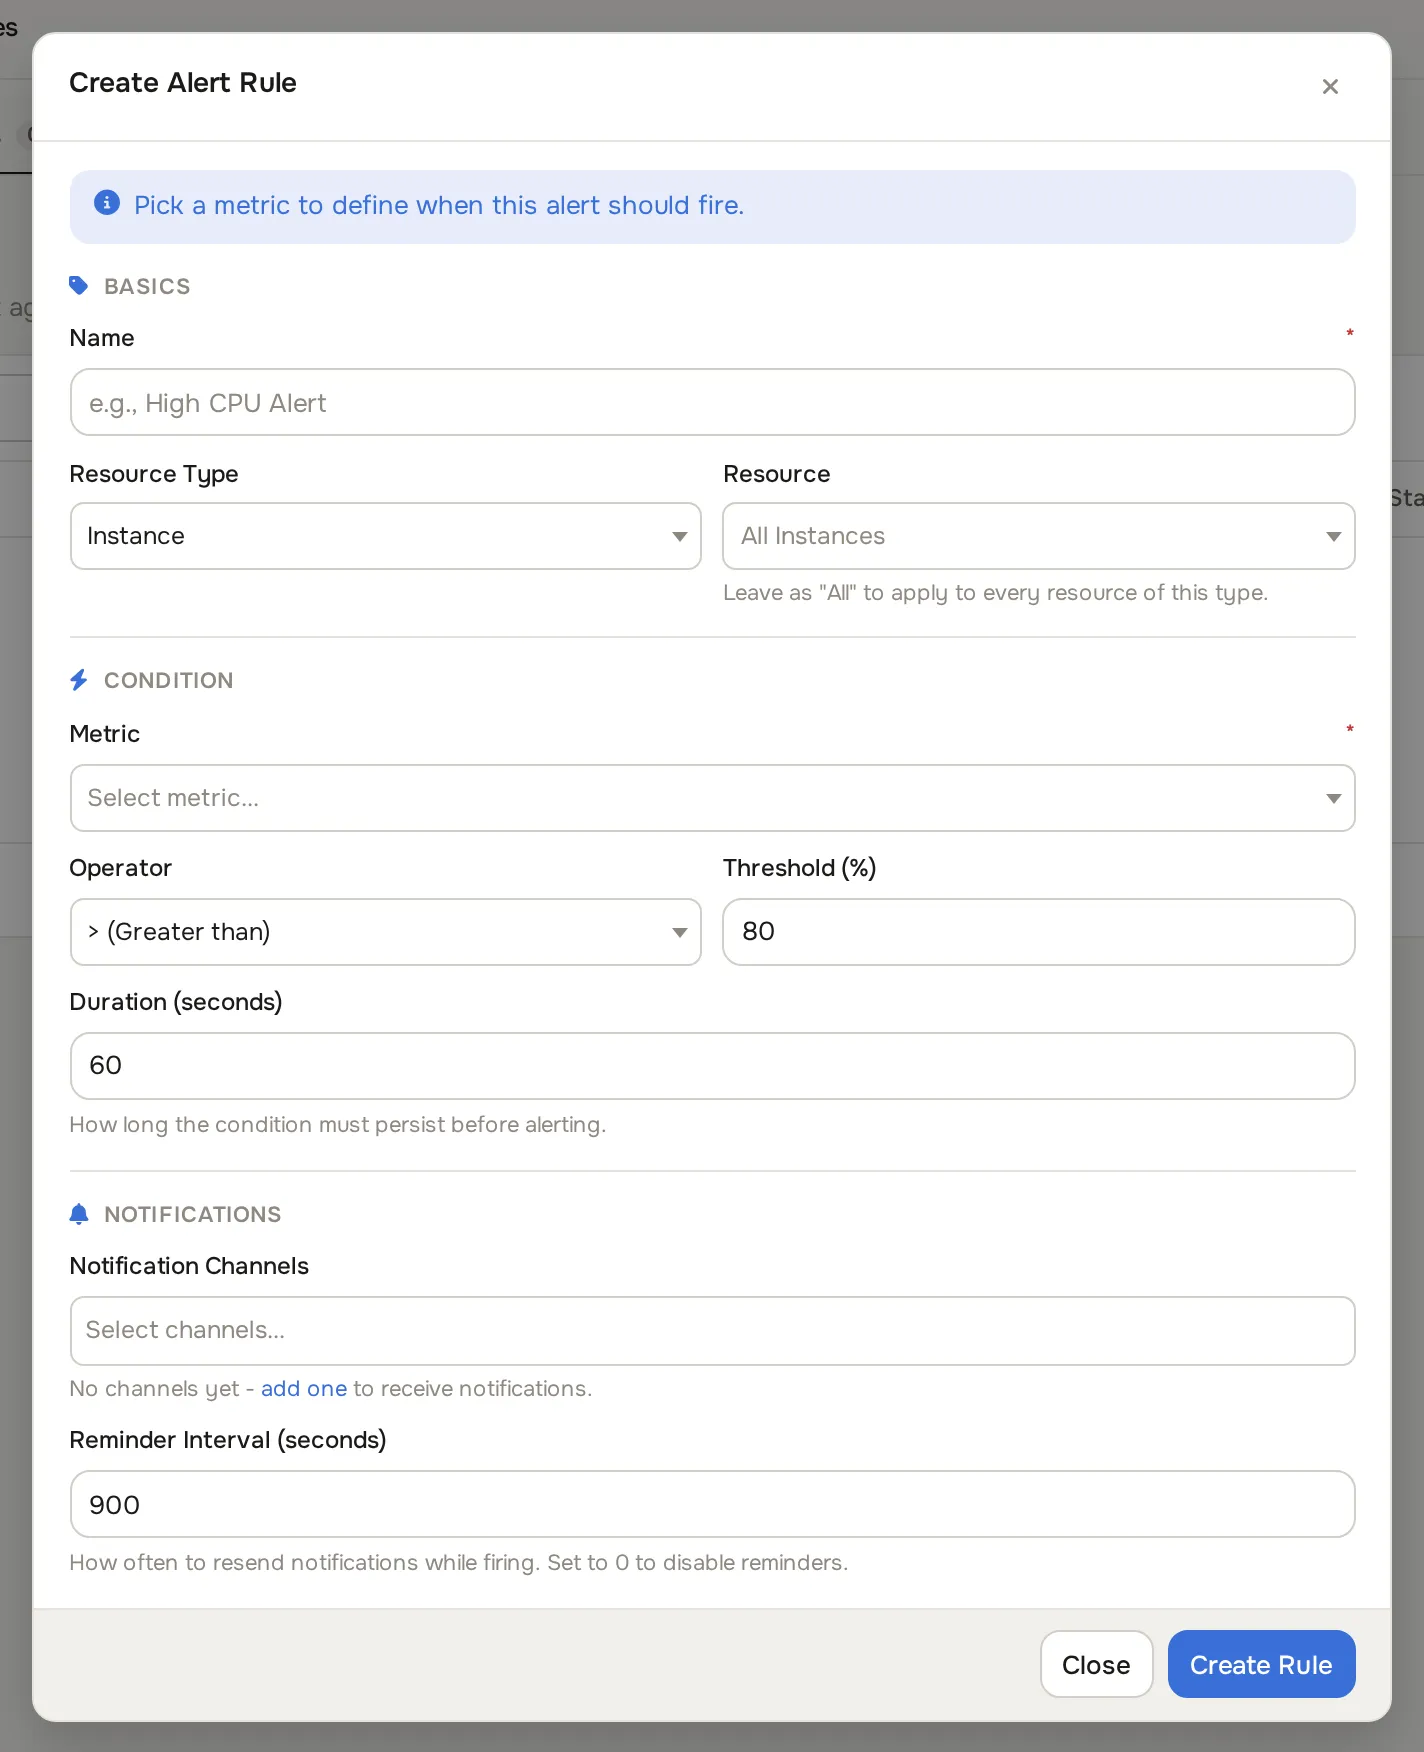
Open the Alert rules tab and click Create Alert Rule. The create dialog opens.
-
Fill in:
Fields
| Field | What to enter |
|---|---|
| Name | A label, for example High CPU on web-1. |
| Resource Type / Resource | What to watch: an instance, database, load balancer, certificate, and so on. |
| Metric | The measurement to watch (the list changes with the resource type; for a certificate there is a days-until-expiry metric). |
| Operator / Threshold | The comparison and the value it crosses. The threshold unit shows next to the field. |
| Duration (seconds) | How long the condition must hold before the rule fires. |
| Notification Channels | Which channels to notify. |
| Reminder Interval (seconds) | How often to re-notify while the rule keeps firing. |
- Click Create Rule.
Rules show as OK, Firing or paused. On a firing rule you can Acknowledge it (silence it while you work), Pause/Resume it, edit it, or delete it. Both the Alert rules and Channels tab labels carry a count badge showing how many rules or channels exist.
History
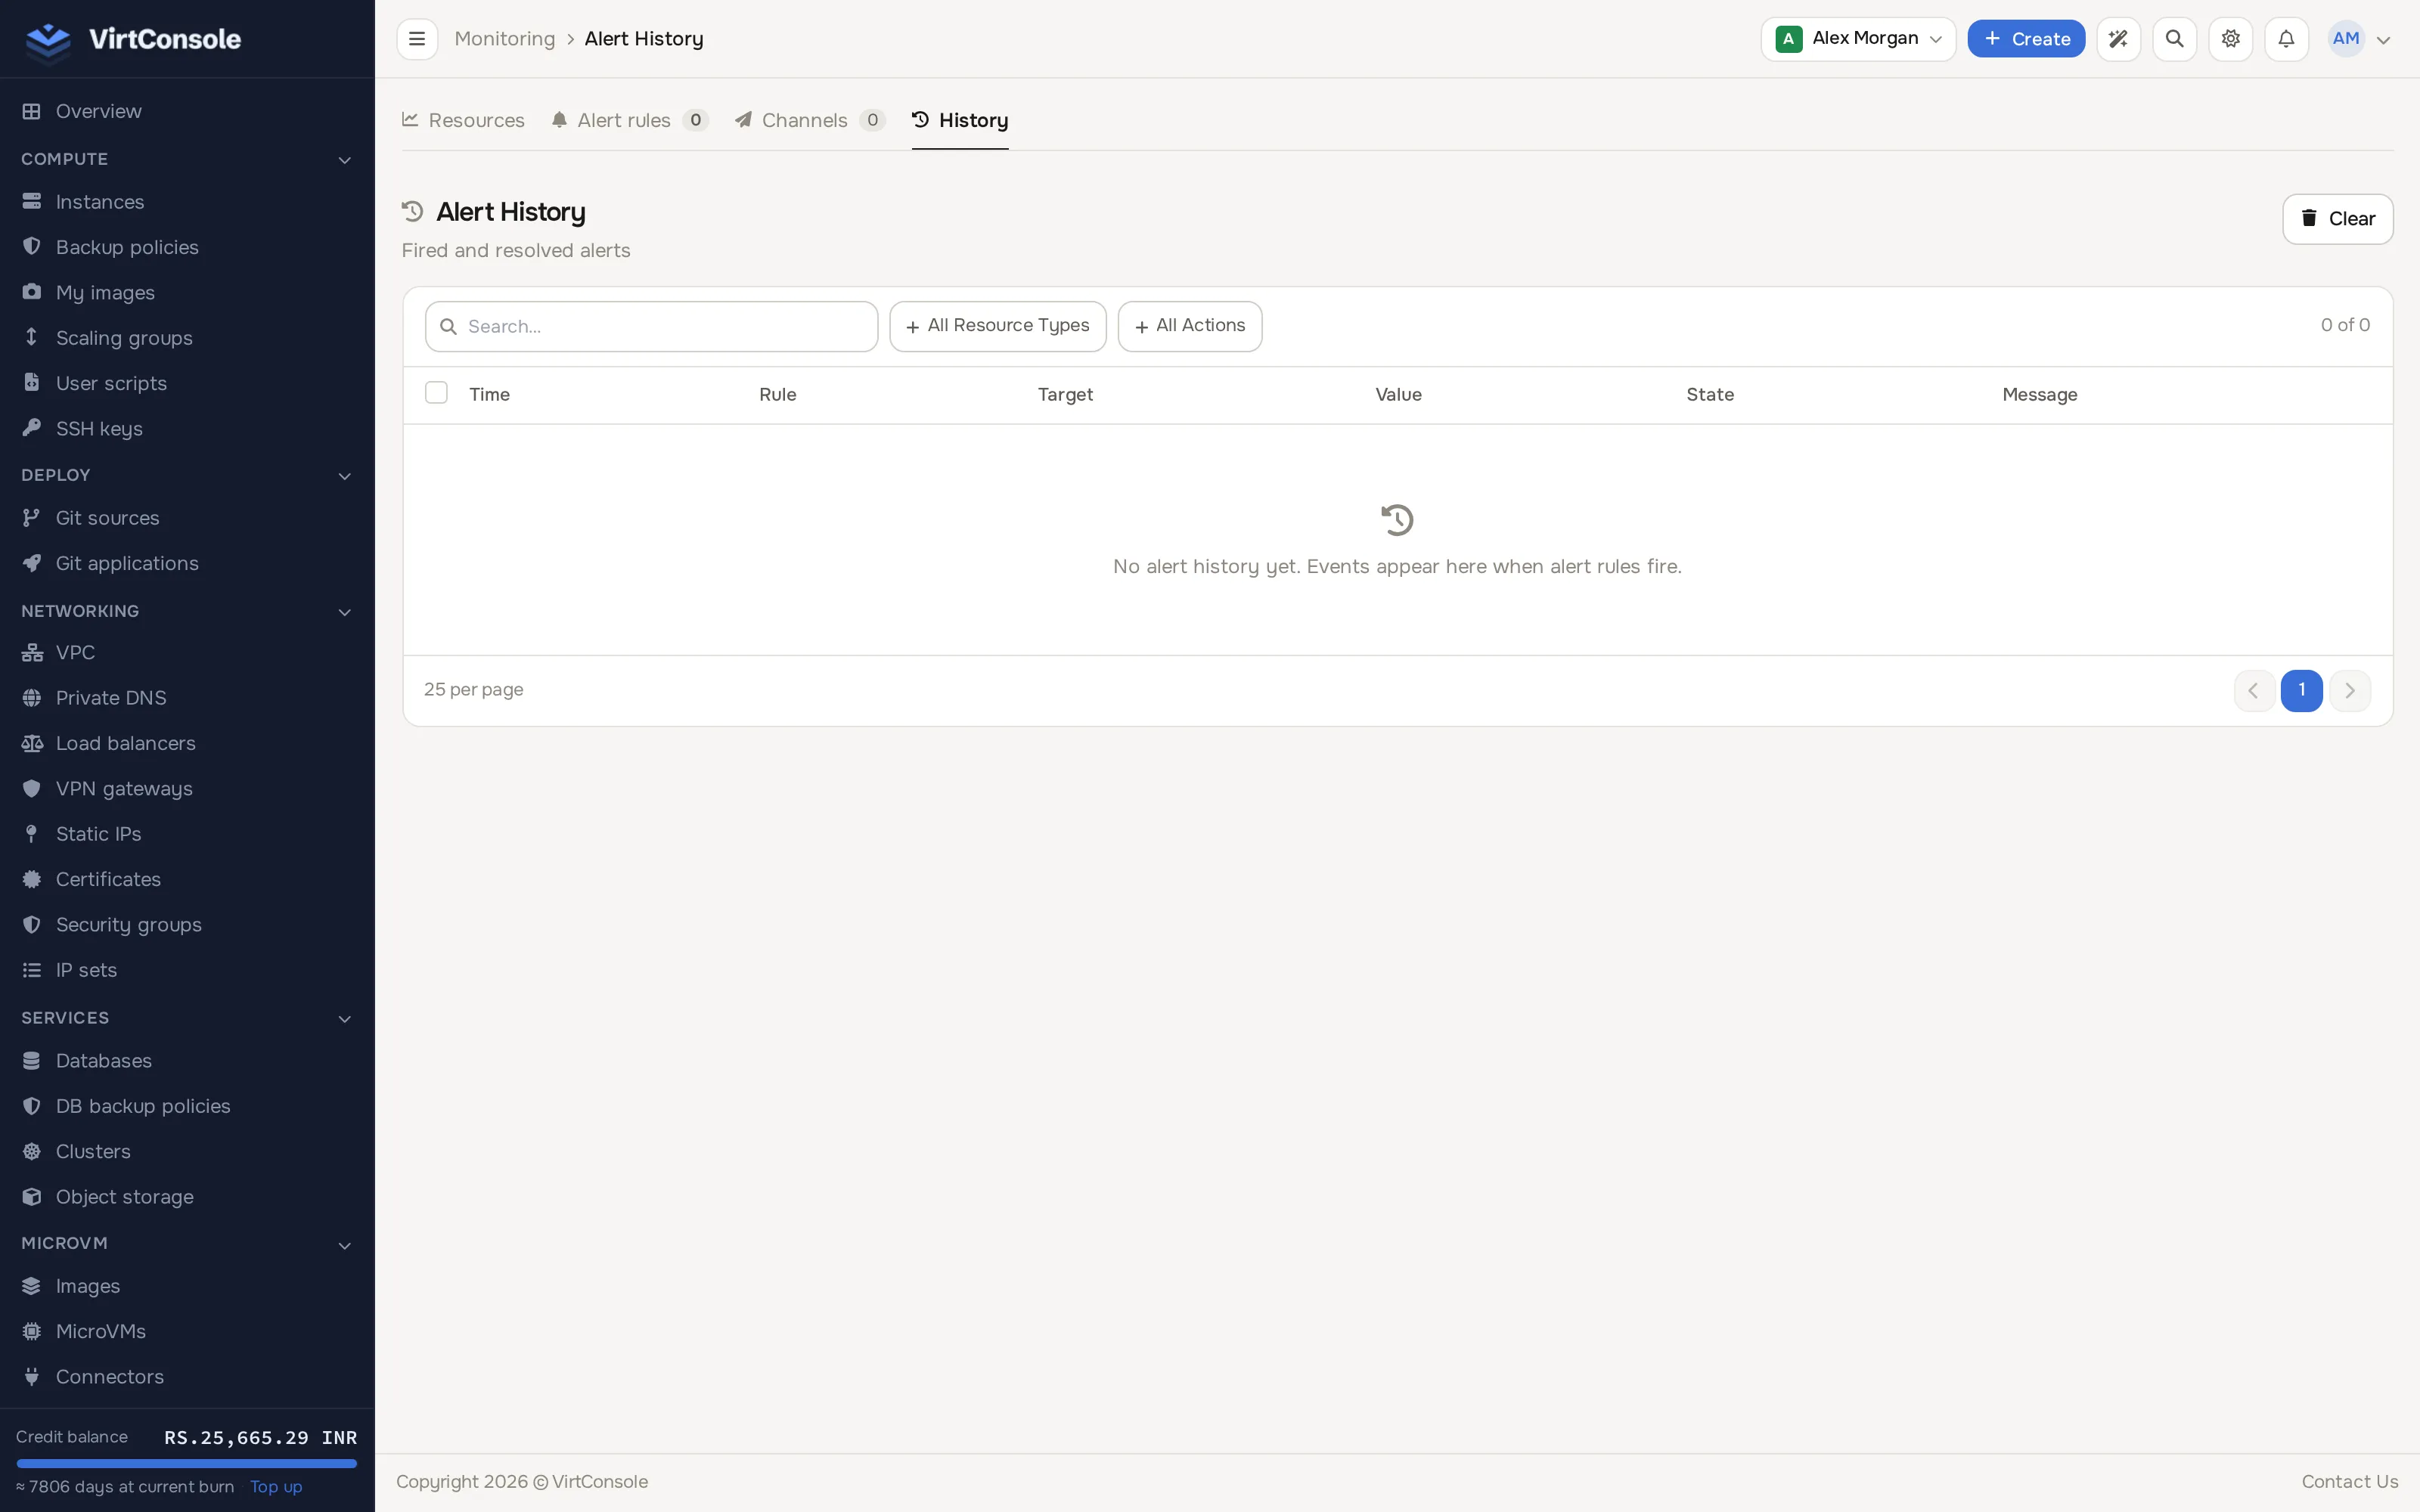
Section titled “History”The History tab lists every time a rule fired, with timestamps and the values that triggered it. Use Clear to empty the history.
Common problems
Section titled “Common problems”- The graphs for one resource are empty. Metrics for that resource’s location may not be configured, or its in-guest agent is broken. For managed databases, use Fix Monitoring on the database’s Metrics tab; otherwise contact your provider.
- My channel’s test notification never arrives. Check the webhook URL or token, and that the receiving service allows the POST. Channels that fail repeatedly may be disabled automatically; re-enable after fixing the cause.
- An alert fires constantly. Raise the threshold or lengthen the “condition must hold” duration so brief spikes do not trigger it.