Monitoring
Overview
This page covers the admin-side pages that record what the platform did and who made it happen. These pages are the first stop when you need to answer "why did this deploy fail?", "is the daily backup actually running?", "who deleted this user?", or "did the suspension email actually go out?".
Five pages are grouped under Monitoring:
- Tasks: every long-running background job (deploy, backup, migrate, snapshot, etc.).
- Scheduler: every recurring job (when it last ran and when it runs next).
- Email Templates: the editable templates the platform uses for every outgoing email.
- Audit Log: every admin action.
- Email Log: every outgoing email.
- IP Log: every panel and API login with the source IP address.
There is also a customer-side monitoring dashboard (CPU and memory charts on each instance) which is documented separately and is not the subject of this page.
Concepts
Task: a row representing one background job the platform is running on your behalf. Each task has a type (instance.deploy, instance.backup, instance.migrate, etc.), a status (pending, running, completed, failed), a progress percentage, and a stream of log lines. Tasks are how the platform reports progress on anything that takes more than a few seconds.
Queue worker: the process that actually picks up and runs tasks. If your queue worker is stopped, tasks pile up in pending and never run.
Scheduled task: a job that runs on a fixed clock, for example "every two minutes, charge hourly billing" or "every day at 02:00, snapshot every instance with daily backup on". The Scheduler page lists each one with its cron expression (the time format that says "every Monday at 03:00", etc.) and its next run time.
Audit log entry: a record of one admin action. Includes the admin user, the action (user.create, instance.delete, setting.edit, ...), the target resource, and a timestamp. Sensitive value changes (passwords, API keys) are recorded as "changed" without the new value.
Email log entry: a record of one outgoing email. Includes the recipient, the template used, the subject, the body, the send status (sent, queued, failed), and the provider's response code.
IP log entry: a record of one panel or API login. Includes the user, the source IP, the user agent (browser identifier), and whether the login succeeded.
Admin steps
Tasks
Open Tasks in the admin sidebar to see every background job on the platform.
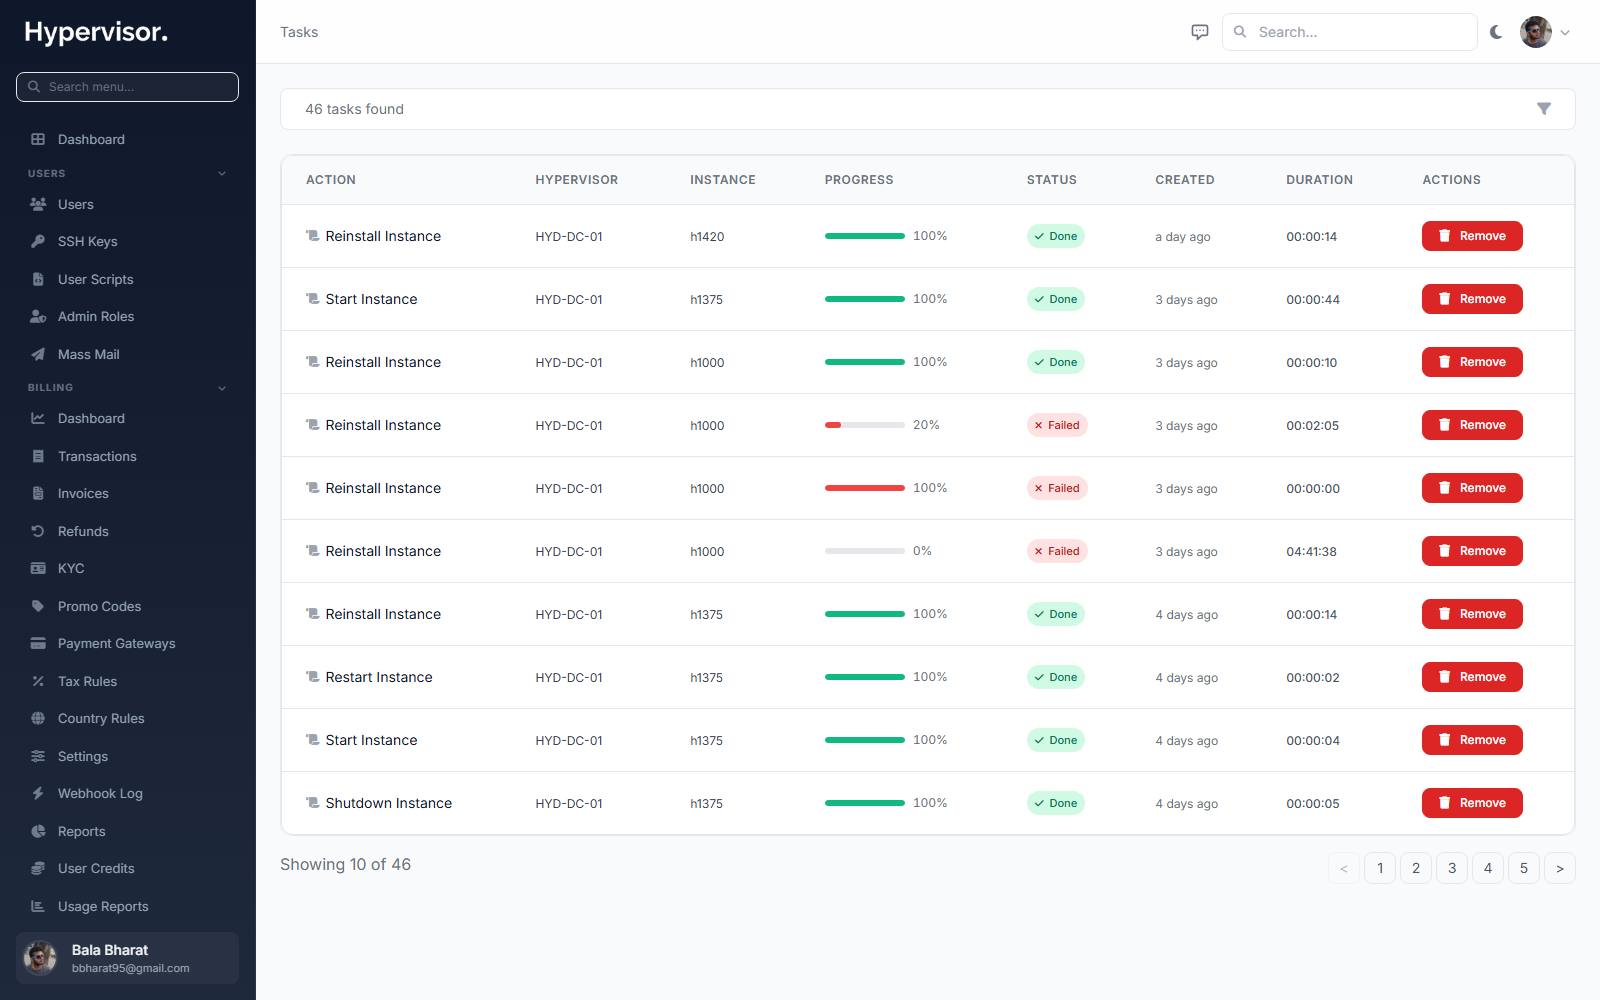
The list streams updates as tasks change state, so you can watch a deploy run in real time. Click any row to expand:
- Header: task type, current status, target user, target hypervisor, target instance.
- Progress bar: 0 to 100 percent.
- Log: each step the worker emitted (DHCP lease assigned, disk attached, OS booted, etc.). The most recent line is at the bottom.
Common operations:
- Filter by type, status, or user to narrow the list (for example, every
instance.deployfrom the last hour). - Retry a failed task that is safe to re-run (the platform marks which task types are idempotent and shows the Retry button only on those).
- Cancel a task that is stuck (only valid while it is
pending; a task already running on a hypervisor cannot be cancelled mid-flight).
If many tasks are stuck on pending, the queue worker is not running. On the master server, start it with php artisan queue:work, or check that the systemd unit is healthy.
Scheduler
Open Scheduler to see every recurring job and when it last and next runs.
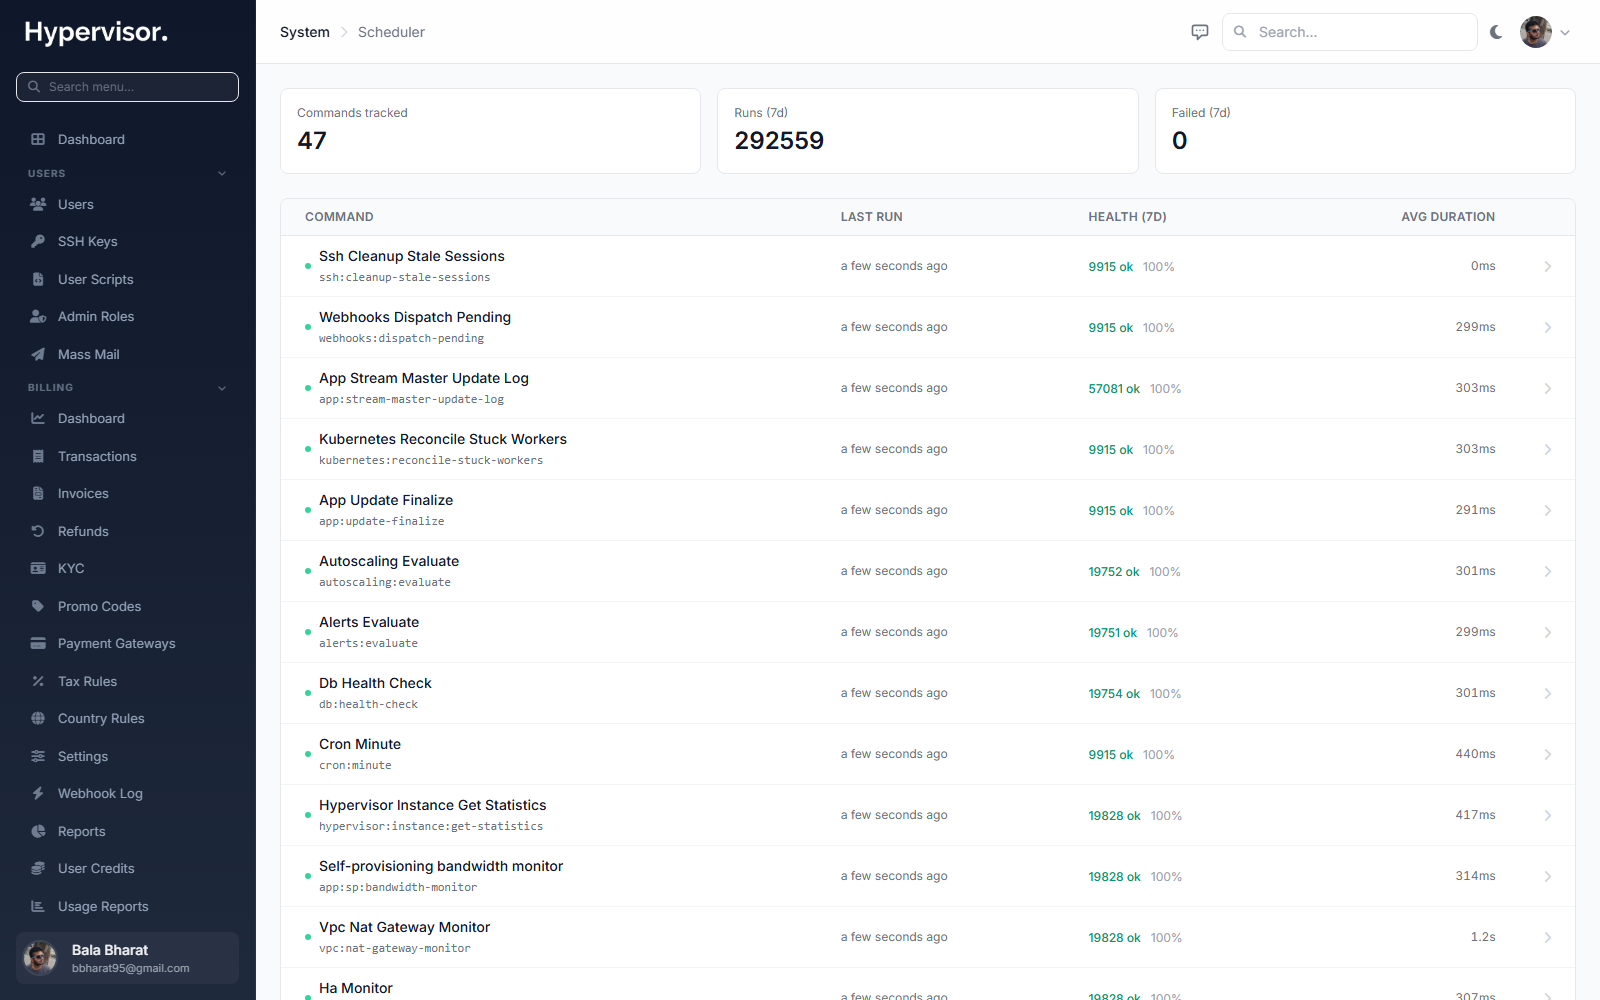
Each row shows the command, its cron expression in plain English ("every two minutes", "daily at 02:00 UTC"), the last run timestamp and result, and the next scheduled run.
You can:
- Click a row to see the last twenty runs with their stdout output. Useful when a daily job has been silently failing.
- Click Run now to trigger the job immediately, without changing its schedule.
If the Last run column is far in the past for every row, the OS cron entry that triggers the scheduler is not running. On the master server, confirm the cron line * * * * * cd /path && php artisan schedule:run is present and enabled.
Email Templates
Open Email Templates to customise the wording of every email the platform sends.

Click Add Template to open the create form.
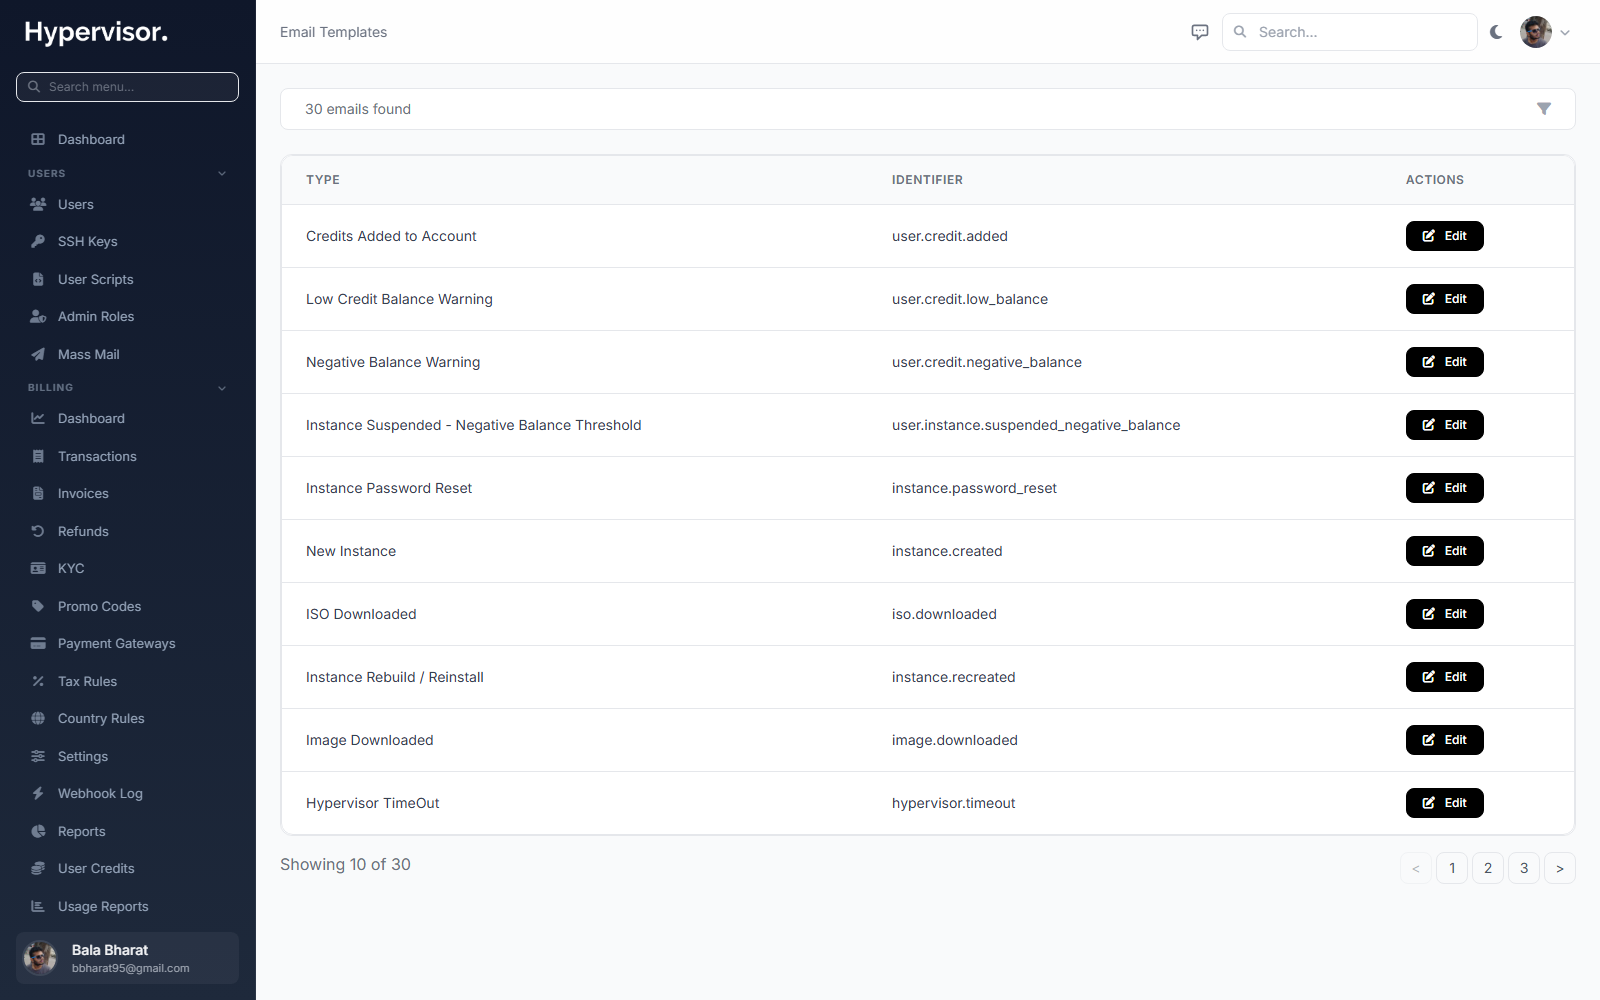
Each template has:
- Name: an internal identifier (
user.welcome,instance.suspended,billing.invoice, etc.). - Subject: the email subject line. Personalization tokens like
{{ user.name }}are expanded per recipient. - Body: the HTML body, with the same token syntax.
- Send test: deliver the rendered template to your own admin address so you can preview it.
Click Reset to default on any template to undo your edits and restore the version that shipped with the platform.
Audit Log
Open Audit Log to see every admin action across the platform.
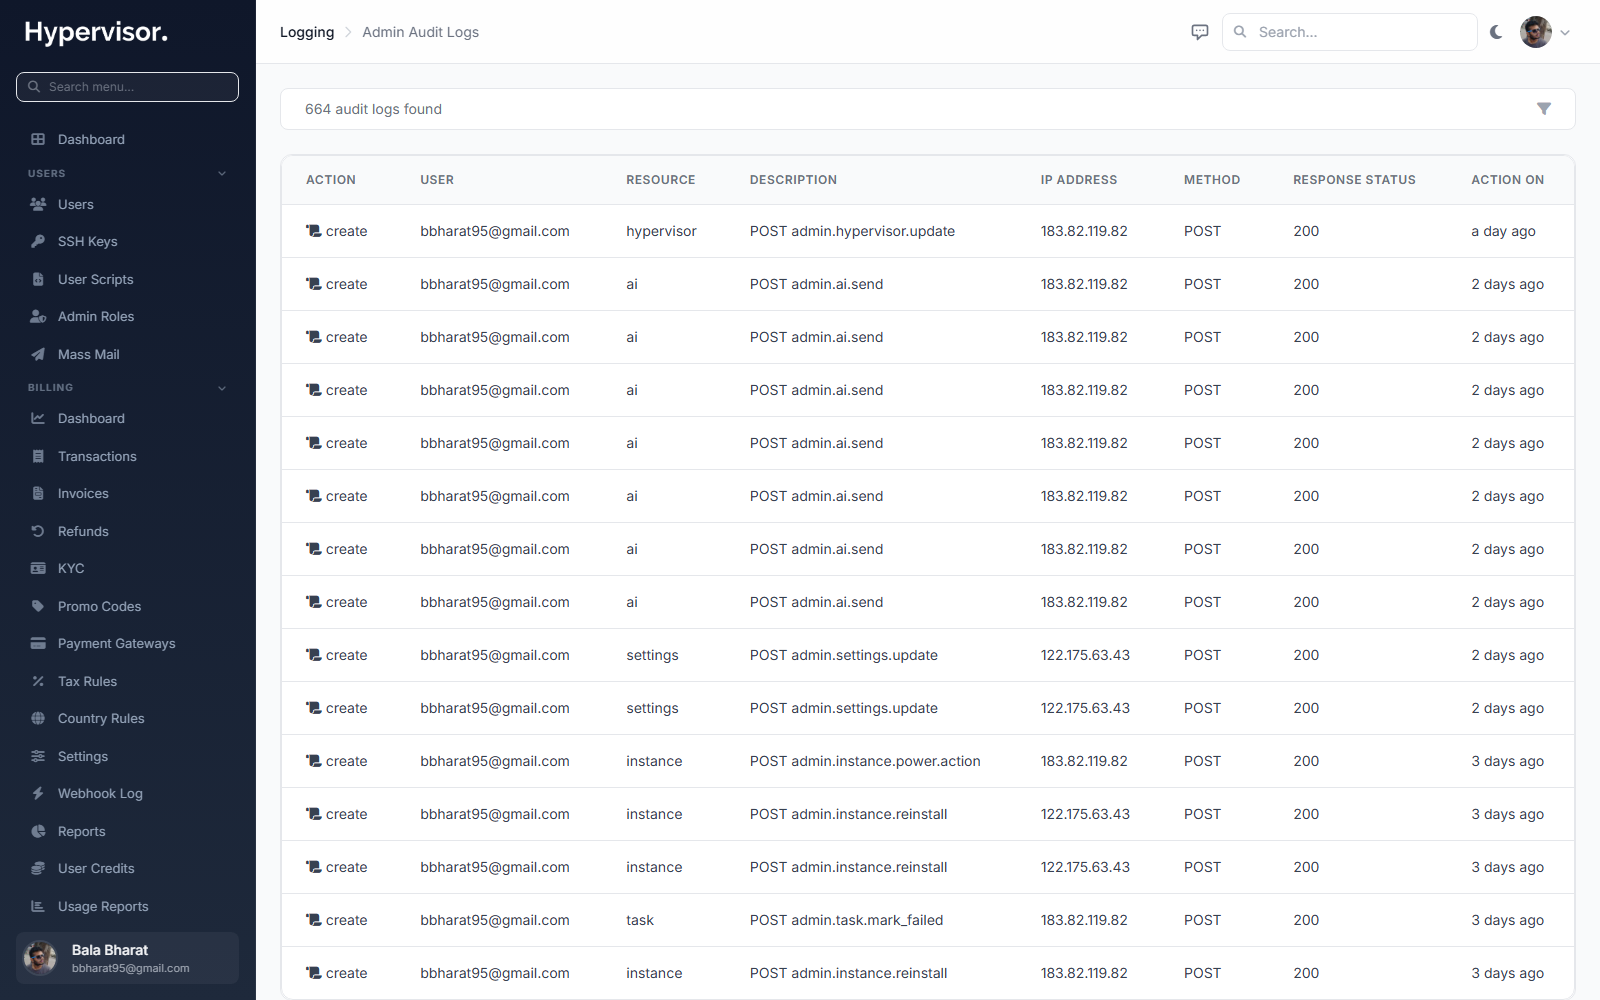
Each entry shows the admin user, the action, the resource, and a timestamp. Sensitive value changes are recorded as a difference without revealing the new value.
Filter the log by:
- Actor: the staff admin that did it.
- Action: for example only
user.deleteevents. - Date range: a specific window.
Audit log entries are retained for the period configured in the platform retention settings. Export a date range as CSV from the toolbar when you need to hand evidence to a compliance review.
Email Log
Open Email Log to see every outgoing email.
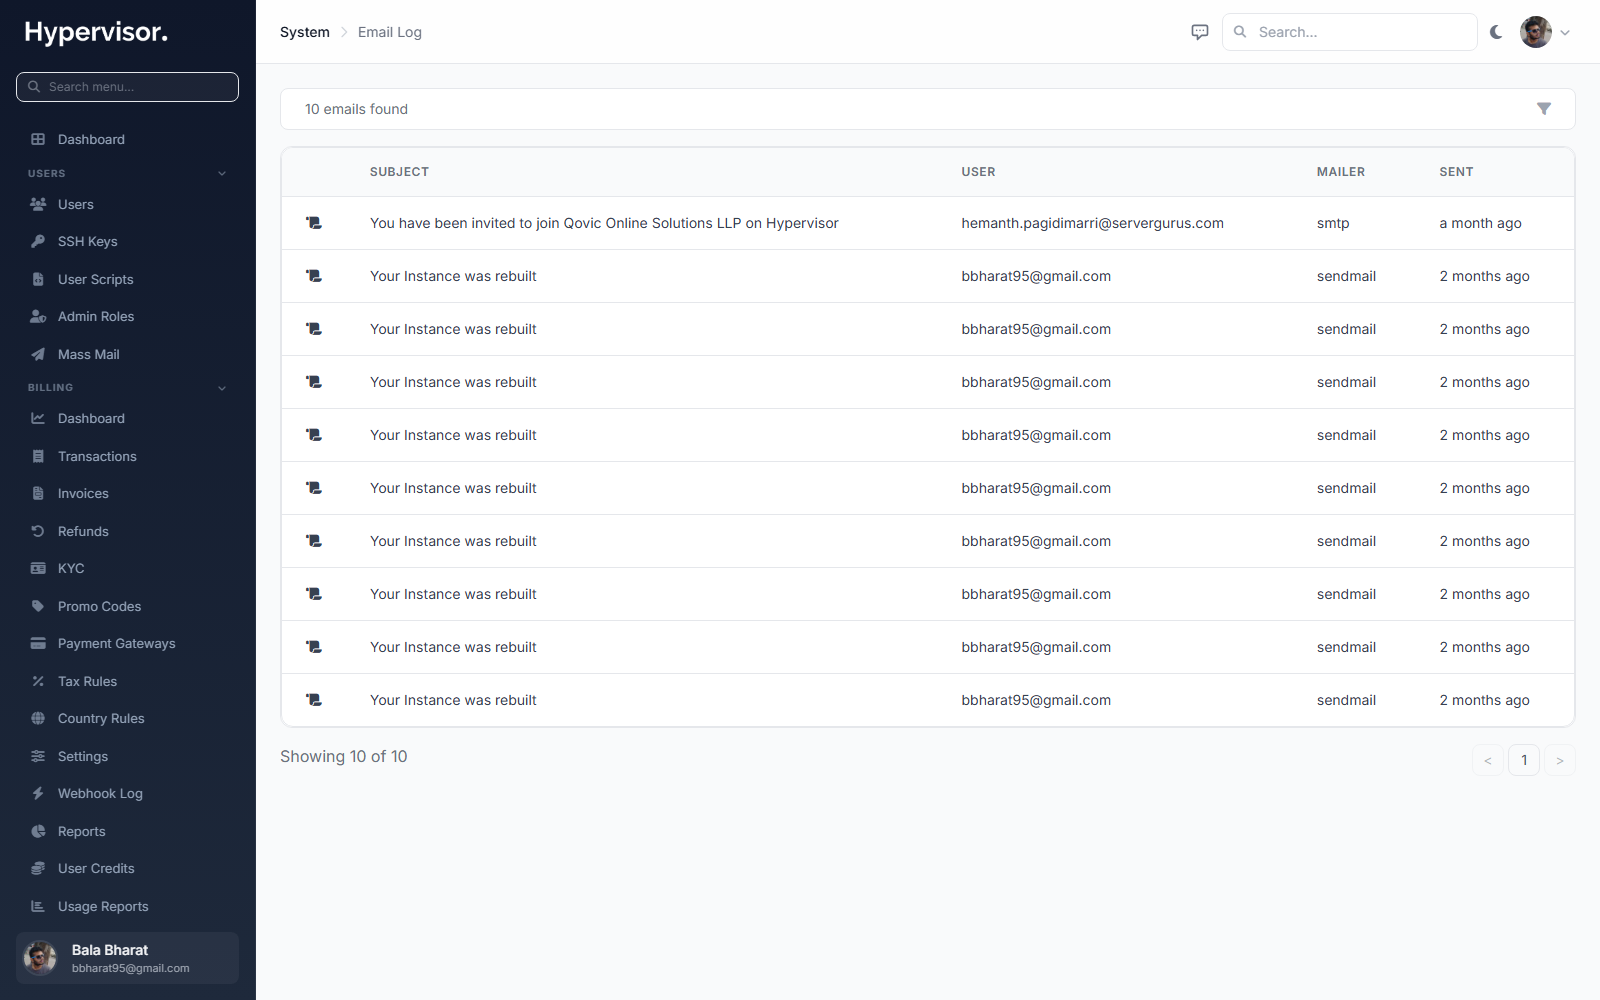
Each entry shows the recipient address, the template used, the subject, the status (sent, queued, failed), the provider response code, and a timestamp. Click a row to read the rendered body exactly as the recipient received it.
The Email Log is the first place to look when a customer says "I never got the verification email" or "my invoice mail never arrived".
IP Log
Open IP Log to see every panel and API login.
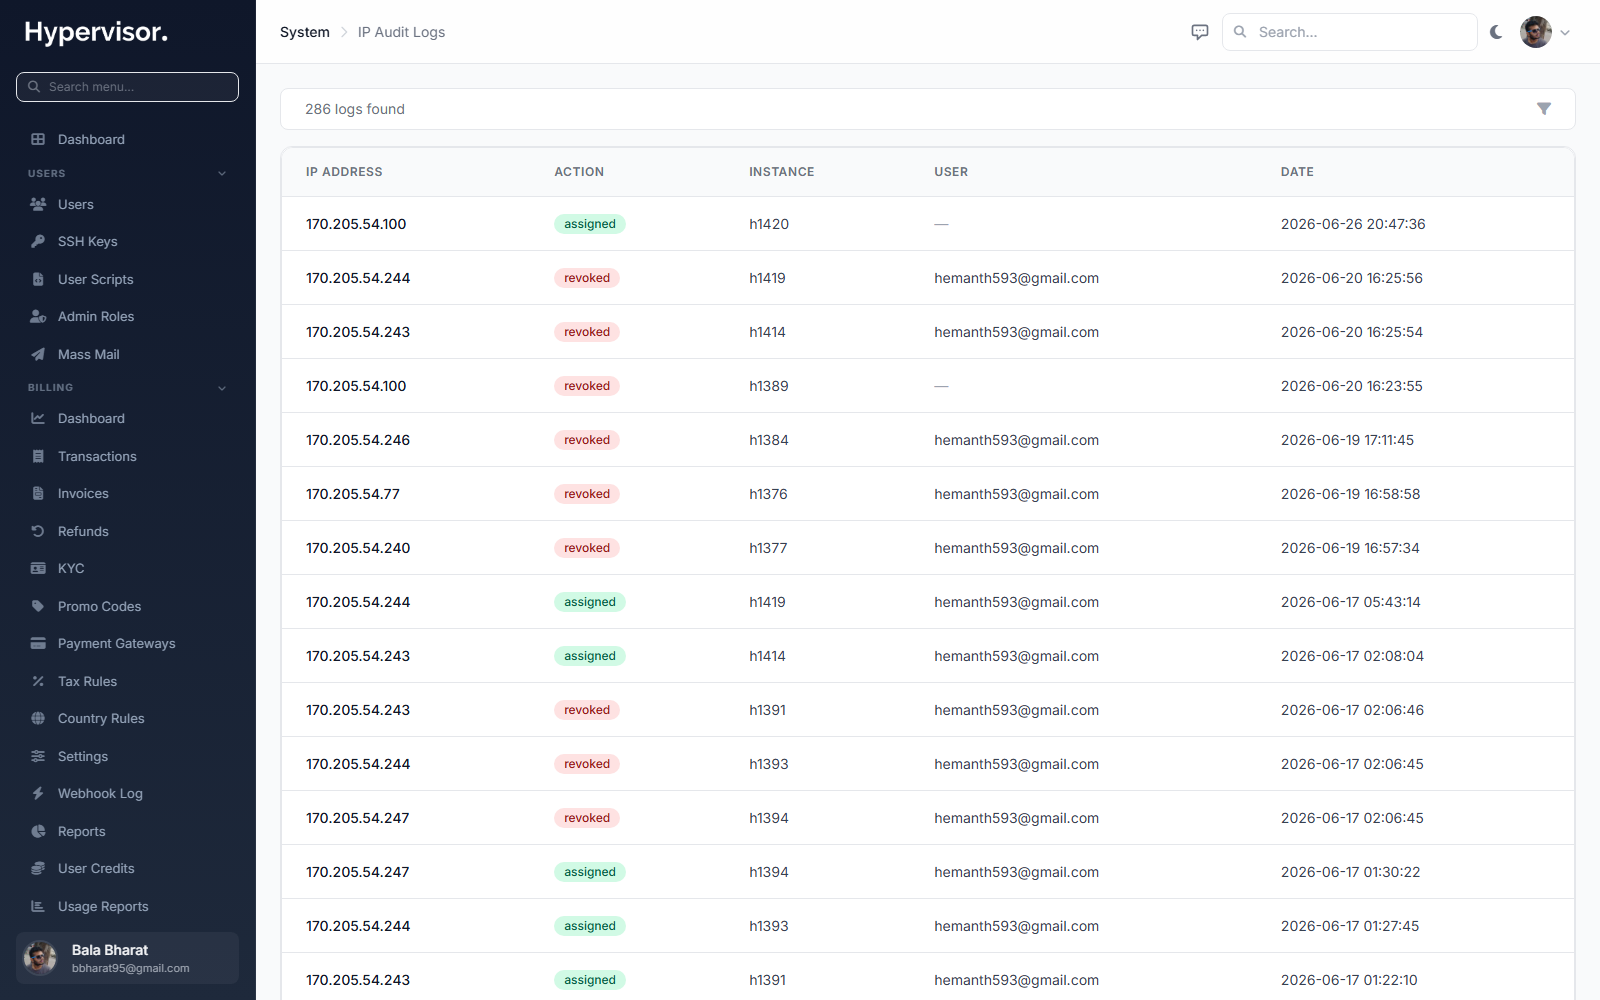
Each entry shows the user, the source IP, the user agent, whether the login succeeded, and the timestamp. Failed logins are recorded too, so the same page doubles as a "is this account being brute-forced?" view.
Filter by user, IP, or only failed attempts. A geographic lookup column shows the country and ASN (Autonomous System Number, an identifier for the network the IP belongs to) so you can spot a logon from an unexpected country.
What end users see
Customers do not see any of these admin pages. They do see:
- Their own tasks (only the ones scoped to their own resources) on the per-instance activity tabs.
- Emails the platform sends them, using the templates you edit under Email Templates.
- A "session expired" or "login from new location" notice if you have those notifications enabled in Settings -> Security, but never the raw IP Log.
Troubleshooting
A deploy task is stuck on running for hours
- Open the task and read the log lines. If the last line is "waiting for hypervisor response", the hypervisor agent on the slave node is unreachable. Check the hypervisor's status under Compute -> Hypervisors.
- If the queue worker process is dead, every task stays in its current state. Restart the worker.
No emails are going out
- Open Settings -> Email and run the Send test email button. Most failures are credential errors that surface there immediately.
- If the test passes but real emails do not arrive, check the Email Log for the recipient. A
failedstatus reveals the provider error.
Scheduler row shows "last run: never"
- The OS cron line that triggers the scheduler is missing. Add it back to the system crontab and the row will populate within a minute.
Audit Log is missing entries an admin claims they did
- Confirm the admin actually signed in to the panel for the action, rather than running an artisan command directly on the server. Direct CLI commands are not captured in the panel audit log.
IP Log shows the same internal IP for every login
- A reverse proxy is in front of the panel without forwarding the real client IP. Add the proxy IP to Settings -> Security -> Trusted Proxies so the
X-Forwarded-Forheader is honoured.
Related pages
- Team Management for the staff admin accounts whose actions appear in the audit log.
- AI Assistant for the Conversations page that pairs with the audit log.